Immigrants from Brazil vs Ukrainian Male Poverty
COMPARE
Immigrants from Brazil
Ukrainian
Male Poverty
Male Poverty Comparison
Immigrants from Brazil
Ukrainians
10.6%
MALE POVERTY
89.0/ 100
METRIC RATING
114th/ 347
METRIC RANK
10.1%
MALE POVERTY
97.9/ 100
METRIC RATING
60th/ 347
METRIC RANK
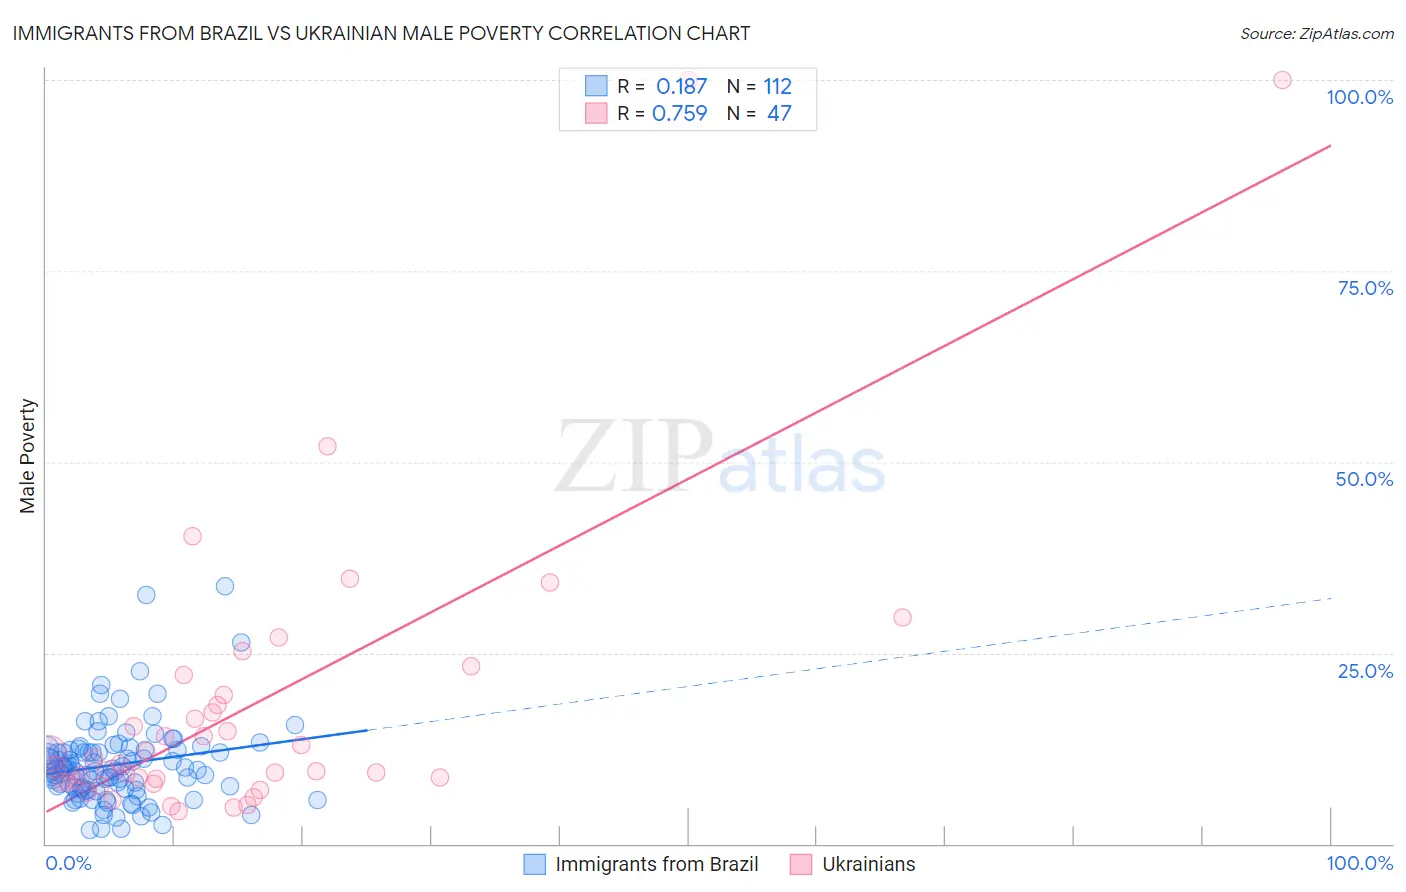
Immigrants from Brazil vs Ukrainian Male Poverty Correlation Chart
The statistical analysis conducted on geographies consisting of 342,783,904 people shows a poor positive correlation between the proportion of Immigrants from Brazil and poverty level among males in the United States with a correlation coefficient (R) of 0.187 and weighted average of 10.6%. Similarly, the statistical analysis conducted on geographies consisting of 447,972,433 people shows a strong positive correlation between the proportion of Ukrainians and poverty level among males in the United States with a correlation coefficient (R) of 0.759 and weighted average of 10.1%, a difference of 4.7%.
Male Poverty Correlation Summary
| Measurement | Immigrants from Brazil | Ukrainian |
| Minimum | 1.8% | 4.2% |
| Maximum | 33.7% | 100.0% |
| Range | 31.9% | 95.8% |
| Mean | 10.3% | 18.1% |
| Median | 9.7% | 10.5% |
| Interquartile 25% (IQ1) | 7.2% | 8.1% |
| Interquartile 75% (IQ3) | 12.3% | 19.5% |
| Interquartile Range (IQR) | 5.1% | 11.4% |
| Standard Deviation (Sample) | 5.3% | 20.2% |
| Standard Deviation (Population) | 5.3% | 20.0% |
Similar Demographics by Male Poverty
Demographics Similar to Immigrants from Brazil by Male Poverty
In terms of male poverty, the demographic groups most similar to Immigrants from Brazil are Palestinian (10.6%, a difference of 0.020%), Immigrants from Turkey (10.6%, a difference of 0.12%), Immigrants from Russia (10.6%, a difference of 0.12%), Immigrants from Argentina (10.6%, a difference of 0.20%), and Sri Lankan (10.6%, a difference of 0.23%).
| Demographics | Rating | Rank | Male Poverty |
| Laotians | 91.2 /100 | #107 | Exceptional 10.5% |
| Portuguese | 91.0 /100 | #108 | Exceptional 10.6% |
| Albanians | 90.6 /100 | #109 | Exceptional 10.6% |
| Argentineans | 90.1 /100 | #110 | Exceptional 10.6% |
| Immigrants | Argentina | 89.8 /100 | #111 | Excellent 10.6% |
| Immigrants | Turkey | 89.5 /100 | #112 | Excellent 10.6% |
| Palestinians | 89.1 /100 | #113 | Excellent 10.6% |
| Immigrants | Brazil | 89.0 /100 | #114 | Excellent 10.6% |
| Immigrants | Russia | 88.6 /100 | #115 | Excellent 10.6% |
| Sri Lankans | 88.1 /100 | #116 | Excellent 10.6% |
| Immigrants | South Eastern Asia | 88.1 /100 | #117 | Excellent 10.6% |
| Okinawans | 87.6 /100 | #118 | Excellent 10.7% |
| Immigrants | Hungary | 87.6 /100 | #119 | Excellent 10.7% |
| Immigrants | China | 87.1 /100 | #120 | Excellent 10.7% |
| Peruvians | 87.1 /100 | #121 | Excellent 10.7% |
Demographics Similar to Ukrainians by Male Poverty
In terms of male poverty, the demographic groups most similar to Ukrainians are Austrian (10.1%, a difference of 0.020%), Immigrants from Europe (10.1%, a difference of 0.090%), Immigrants from Italy (10.2%, a difference of 0.11%), Slovak (10.2%, a difference of 0.15%), and Scandinavian (10.1%, a difference of 0.22%).
| Demographics | Rating | Rank | Male Poverty |
| Immigrants | Czechoslovakia | 98.6 /100 | #53 | Exceptional 10.0% |
| Immigrants | Austria | 98.5 /100 | #54 | Exceptional 10.0% |
| Germans | 98.3 /100 | #55 | Exceptional 10.1% |
| Immigrants | Bulgaria | 98.2 /100 | #56 | Exceptional 10.1% |
| Estonians | 98.1 /100 | #57 | Exceptional 10.1% |
| Scandinavians | 98.0 /100 | #58 | Exceptional 10.1% |
| Immigrants | Europe | 97.9 /100 | #59 | Exceptional 10.1% |
| Ukrainians | 97.9 /100 | #60 | Exceptional 10.1% |
| Austrians | 97.8 /100 | #61 | Exceptional 10.1% |
| Immigrants | Italy | 97.8 /100 | #62 | Exceptional 10.2% |
| Slovaks | 97.7 /100 | #63 | Exceptional 10.2% |
| Swiss | 97.5 /100 | #64 | Exceptional 10.2% |
| Zimbabweans | 97.5 /100 | #65 | Exceptional 10.2% |
| Serbians | 97.5 /100 | #66 | Exceptional 10.2% |
| Immigrants | Netherlands | 97.3 /100 | #67 | Exceptional 10.2% |