Immigrants from Bosnia and Herzegovina vs Puerto Rican Female Poverty Among 18-24 Year Olds
COMPARE
Immigrants from Bosnia and Herzegovina
Puerto Rican
Female Poverty Among 18-24 Year Olds
Female Poverty Among 18-24 Year Olds Comparison
Immigrants from Bosnia and Herzegovina
Puerto Ricans
19.7%
FEMALE POVERTY AMONG 18-24 YEAR OLDS
83.6/ 100
METRIC RATING
146th/ 347
METRIC RANK
29.8%
FEMALE POVERTY AMONG 18-24 YEAR OLDS
0.0/ 100
METRIC RATING
343rd/ 347
METRIC RANK
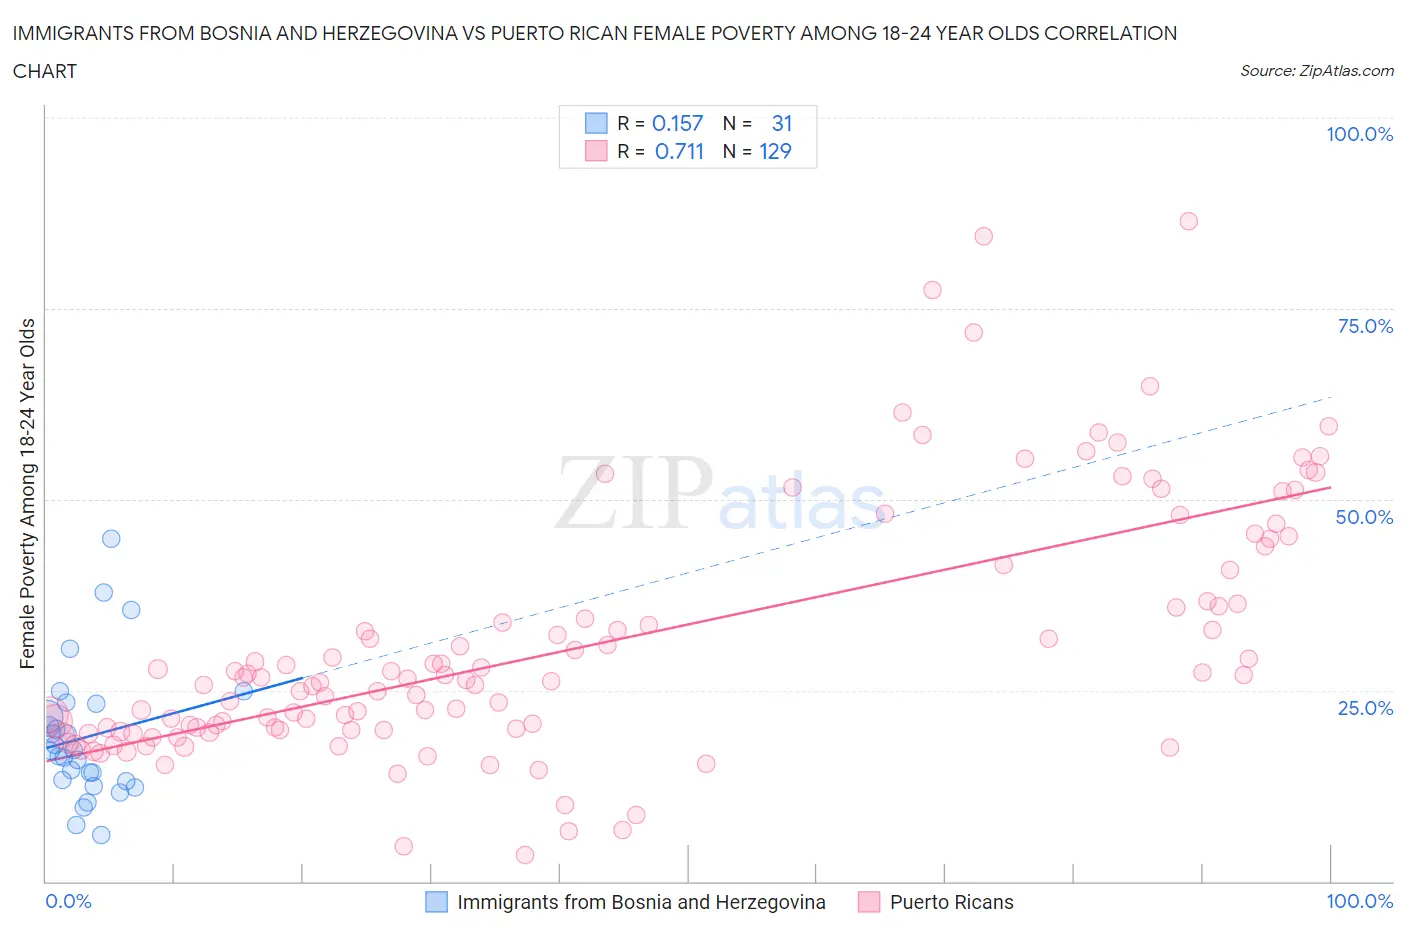
Immigrants from Bosnia and Herzegovina vs Puerto Rican Female Poverty Among 18-24 Year Olds Correlation Chart
The statistical analysis conducted on geographies consisting of 155,470,842 people shows a poor positive correlation between the proportion of Immigrants from Bosnia and Herzegovina and poverty level among females between the ages 18 and 24 in the United States with a correlation coefficient (R) of 0.157 and weighted average of 19.7%. Similarly, the statistical analysis conducted on geographies consisting of 506,051,184 people shows a strong positive correlation between the proportion of Puerto Ricans and poverty level among females between the ages 18 and 24 in the United States with a correlation coefficient (R) of 0.711 and weighted average of 29.8%, a difference of 51.4%.
Female Poverty Among 18-24 Year Olds Correlation Summary
| Measurement | Immigrants from Bosnia and Herzegovina | Puerto Rican |
| Minimum | 6.0% | 3.5% |
| Maximum | 44.9% | 86.4% |
| Range | 38.8% | 82.9% |
| Mean | 18.9% | 31.0% |
| Median | 17.1% | 26.6% |
| Interquartile 25% (IQ1) | 13.1% | 19.8% |
| Interquartile 75% (IQ3) | 23.2% | 38.7% |
| Interquartile Range (IQR) | 10.1% | 18.9% |
| Standard Deviation (Sample) | 8.8% | 16.4% |
| Standard Deviation (Population) | 8.6% | 16.3% |
Similar Demographics by Female Poverty Among 18-24 Year Olds
Demographics Similar to Immigrants from Bosnia and Herzegovina by Female Poverty Among 18-24 Year Olds
In terms of female poverty among 18-24 year olds, the demographic groups most similar to Immigrants from Bosnia and Herzegovina are Canadian (19.7%, a difference of 0.020%), Immigrants from Northern Africa (19.7%, a difference of 0.050%), Immigrants from Austria (19.7%, a difference of 0.050%), Slavic (19.7%, a difference of 0.080%), and Panamanian (19.7%, a difference of 0.090%).
| Demographics | Rating | Rank | Female Poverty Among 18-24 Year Olds |
| Indians (Asian) | 88.3 /100 | #139 | Excellent 19.6% |
| Immigrants | Trinidad and Tobago | 85.6 /100 | #140 | Excellent 19.7% |
| Pennsylvania Germans | 85.5 /100 | #141 | Excellent 19.7% |
| Panamanians | 84.6 /100 | #142 | Excellent 19.7% |
| Slavs | 84.4 /100 | #143 | Excellent 19.7% |
| Immigrants | Northern Africa | 84.1 /100 | #144 | Excellent 19.7% |
| Canadians | 83.8 /100 | #145 | Excellent 19.7% |
| Immigrants | Bosnia and Herzegovina | 83.6 /100 | #146 | Excellent 19.7% |
| Immigrants | Austria | 83.1 /100 | #147 | Excellent 19.7% |
| Immigrants | Latin America | 81.3 /100 | #148 | Excellent 19.7% |
| Immigrants | Oceania | 81.2 /100 | #149 | Excellent 19.7% |
| Syrians | 80.2 /100 | #150 | Excellent 19.8% |
| Immigrants | Eastern Asia | 79.7 /100 | #151 | Good 19.8% |
| Yugoslavians | 79.0 /100 | #152 | Good 19.8% |
| Immigrants | Japan | 78.1 /100 | #153 | Good 19.8% |
Demographics Similar to Puerto Ricans by Female Poverty Among 18-24 Year Olds
In terms of female poverty among 18-24 year olds, the demographic groups most similar to Puerto Ricans are Navajo (30.3%, a difference of 1.6%), Kiowa (29.2%, a difference of 2.1%), Colville (29.0%, a difference of 2.8%), Tohono O'odham (31.0%, a difference of 3.9%), and Lumbee (31.1%, a difference of 4.1%).
| Demographics | Rating | Rank | Female Poverty Among 18-24 Year Olds |
| Apache | 0.0 /100 | #333 | Tragic 26.3% |
| Pueblo | 0.0 /100 | #334 | Tragic 26.9% |
| Yup'ik | 0.0 /100 | #335 | Tragic 27.0% |
| Immigrants | Yemen | 0.0 /100 | #336 | Tragic 27.5% |
| Cheyenne | 0.0 /100 | #337 | Tragic 28.1% |
| Hopi | 0.0 /100 | #338 | Tragic 28.2% |
| Pima | 0.0 /100 | #339 | Tragic 28.4% |
| Sioux | 0.0 /100 | #340 | Tragic 28.6% |
| Colville | 0.0 /100 | #341 | Tragic 29.0% |
| Kiowa | 0.0 /100 | #342 | Tragic 29.2% |
| Puerto Ricans | 0.0 /100 | #343 | Tragic 29.8% |
| Navajo | 0.0 /100 | #344 | Tragic 30.3% |
| Tohono O'odham | 0.0 /100 | #345 | Tragic 31.0% |
| Lumbee | 0.0 /100 | #346 | Tragic 31.1% |
| Crow | 0.0 /100 | #347 | Tragic 33.2% |