Immigrants from Bolivia vs French Canadian Single Father Poverty
COMPARE
Immigrants from Bolivia
French Canadian
Single Father Poverty
Single Father Poverty Comparison
Immigrants from Bolivia
French Canadians
14.7%
SINGLE FATHER POVERTY
100.0/ 100
METRIC RATING
35th/ 347
METRIC RANK
18.6%
SINGLE FATHER POVERTY
0.0/ 100
METRIC RATING
307th/ 347
METRIC RANK
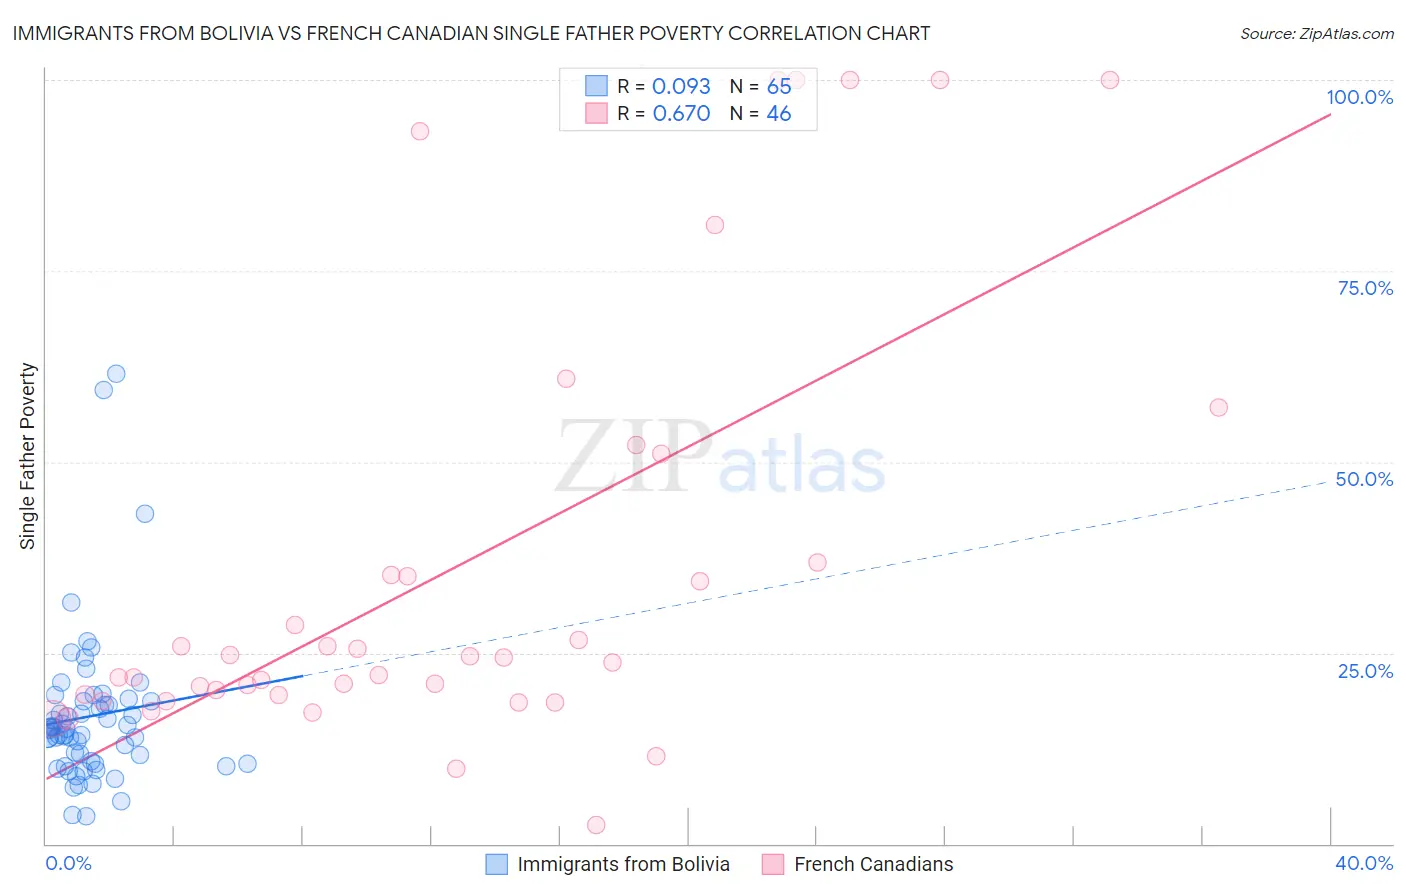
Immigrants from Bolivia vs French Canadian Single Father Poverty Correlation Chart
The statistical analysis conducted on geographies consisting of 137,322,784 people shows a slight positive correlation between the proportion of Immigrants from Bolivia and poverty level among single fathers in the United States with a correlation coefficient (R) of 0.093 and weighted average of 14.7%. Similarly, the statistical analysis conducted on geographies consisting of 372,635,885 people shows a significant positive correlation between the proportion of French Canadians and poverty level among single fathers in the United States with a correlation coefficient (R) of 0.670 and weighted average of 18.6%, a difference of 26.6%.
Single Father Poverty Correlation Summary
| Measurement | Immigrants from Bolivia | French Canadian |
| Minimum | 3.6% | 2.5% |
| Maximum | 61.5% | 100.0% |
| Range | 58.0% | 97.5% |
| Mean | 16.7% | 36.1% |
| Median | 15.0% | 24.1% |
| Interquartile 25% (IQ1) | 10.6% | 19.5% |
| Interquartile 75% (IQ3) | 18.6% | 36.8% |
| Interquartile Range (IQR) | 8.0% | 17.3% |
| Standard Deviation (Sample) | 10.2% | 28.3% |
| Standard Deviation (Population) | 10.1% | 28.0% |
Similar Demographics by Single Father Poverty
Demographics Similar to Immigrants from Bolivia by Single Father Poverty
In terms of single father poverty, the demographic groups most similar to Immigrants from Bolivia are Egyptian (14.7%, a difference of 0.070%), Okinawan (14.6%, a difference of 0.17%), Immigrants from Indonesia (14.7%, a difference of 0.17%), Immigrants from Eastern Africa (14.7%, a difference of 0.29%), and Bolivian (14.7%, a difference of 0.30%).
| Demographics | Rating | Rank | Single Father Poverty |
| Immigrants | South Central Asia | 100.0 /100 | #28 | Exceptional 14.5% |
| Somalis | 100.0 /100 | #29 | Exceptional 14.5% |
| Thais | 100.0 /100 | #30 | Exceptional 14.5% |
| Icelanders | 100.0 /100 | #31 | Exceptional 14.5% |
| Asians | 100.0 /100 | #32 | Exceptional 14.6% |
| Okinawans | 100.0 /100 | #33 | Exceptional 14.6% |
| Egyptians | 100.0 /100 | #34 | Exceptional 14.7% |
| Immigrants | Bolivia | 100.0 /100 | #35 | Exceptional 14.7% |
| Immigrants | Indonesia | 100.0 /100 | #36 | Exceptional 14.7% |
| Immigrants | Eastern Africa | 100.0 /100 | #37 | Exceptional 14.7% |
| Bolivians | 100.0 /100 | #38 | Exceptional 14.7% |
| Immigrants | Asia | 100.0 /100 | #39 | Exceptional 14.7% |
| Pima | 100.0 /100 | #40 | Exceptional 14.8% |
| Indians (Asian) | 100.0 /100 | #41 | Exceptional 14.8% |
| Immigrants | Nepal | 100.0 /100 | #42 | Exceptional 14.8% |
Demographics Similar to French Canadians by Single Father Poverty
In terms of single father poverty, the demographic groups most similar to French Canadians are Ottawa (18.6%, a difference of 0.020%), Scotch-Irish (18.6%, a difference of 0.040%), Immigrants from Micronesia (18.6%, a difference of 0.13%), Blackfeet (18.5%, a difference of 0.26%), and Ute (18.5%, a difference of 0.31%).
| Demographics | Rating | Rank | Single Father Poverty |
| Immigrants | Dominican Republic | 0.0 /100 | #300 | Tragic 18.4% |
| Hungarians | 0.0 /100 | #301 | Tragic 18.5% |
| Comanche | 0.0 /100 | #302 | Tragic 18.5% |
| Celtics | 0.0 /100 | #303 | Tragic 18.5% |
| Ute | 0.0 /100 | #304 | Tragic 18.5% |
| Blackfeet | 0.0 /100 | #305 | Tragic 18.5% |
| Scotch-Irish | 0.0 /100 | #306 | Tragic 18.6% |
| French Canadians | 0.0 /100 | #307 | Tragic 18.6% |
| Ottawa | 0.0 /100 | #308 | Tragic 18.6% |
| Immigrants | Micronesia | 0.0 /100 | #309 | Tragic 18.6% |
| Chippewa | 0.0 /100 | #310 | Tragic 18.8% |
| Immigrants | Nonimmigrants | 0.0 /100 | #311 | Tragic 18.8% |
| Immigrants | Dominica | 0.0 /100 | #312 | Tragic 18.9% |
| Potawatomi | 0.0 /100 | #313 | Tragic 18.9% |
| Delaware | 0.0 /100 | #314 | Tragic 18.9% |