Immigrants from Belize vs Welsh Single Male Poverty
COMPARE
Immigrants from Belize
Welsh
Single Male Poverty
Single Male Poverty Comparison
Immigrants from Belize
Welsh
13.7%
SINGLE MALE POVERTY
0.4/ 100
METRIC RATING
256th/ 347
METRIC RANK
14.0%
SINGLE MALE POVERTY
0.1/ 100
METRIC RATING
273rd/ 347
METRIC RANK
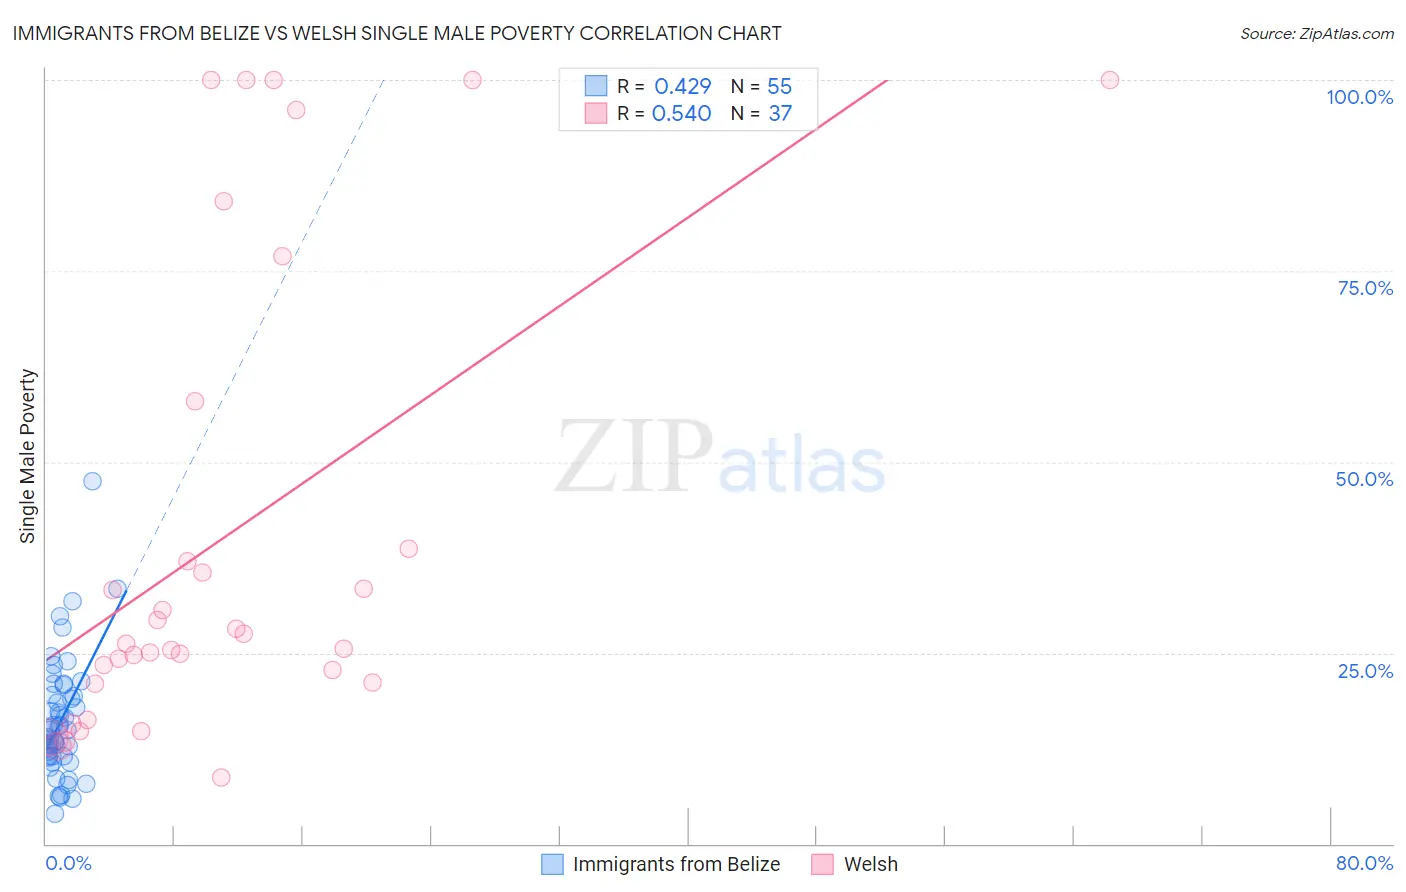
Immigrants from Belize vs Welsh Single Male Poverty Correlation Chart
The statistical analysis conducted on geographies consisting of 125,025,572 people shows a moderate positive correlation between the proportion of Immigrants from Belize and poverty level among single males in the United States with a correlation coefficient (R) of 0.429 and weighted average of 13.7%. Similarly, the statistical analysis conducted on geographies consisting of 442,898,896 people shows a substantial positive correlation between the proportion of Welsh and poverty level among single males in the United States with a correlation coefficient (R) of 0.540 and weighted average of 14.0%, a difference of 2.2%.
Single Male Poverty Correlation Summary
| Measurement | Immigrants from Belize | Welsh |
| Minimum | 4.0% | 8.7% |
| Maximum | 47.5% | 100.0% |
| Range | 43.5% | 91.3% |
| Mean | 16.1% | 40.1% |
| Median | 14.8% | 26.2% |
| Interquartile 25% (IQ1) | 11.5% | 21.0% |
| Interquartile 75% (IQ3) | 19.5% | 48.3% |
| Interquartile Range (IQR) | 8.0% | 27.3% |
| Standard Deviation (Sample) | 7.8% | 30.6% |
| Standard Deviation (Population) | 7.8% | 30.2% |
Demographics Similar to Immigrants from Belize and Welsh by Single Male Poverty
In terms of single male poverty, the demographic groups most similar to Immigrants from Belize are Spaniard (13.7%, a difference of 0.10%), Immigrants from Central America (13.8%, a difference of 0.18%), Subsaharan African (13.7%, a difference of 0.21%), Immigrants from Guatemala (13.8%, a difference of 0.25%), and Guatemalan (13.8%, a difference of 0.29%). Similarly, the demographic groups most similar to Welsh are Honduran (14.0%, a difference of 0.13%), Mexican (14.0%, a difference of 0.35%), Irish (14.0%, a difference of 0.41%), Immigrants from Saudi Arabia (14.0%, a difference of 0.44%), and Scottish (14.0%, a difference of 0.46%).
| Demographics | Rating | Rank | Single Male Poverty |
| Sub-Saharan Africans | 0.5 /100 | #254 | Tragic 13.7% |
| Spaniards | 0.4 /100 | #255 | Tragic 13.7% |
| Immigrants | Belize | 0.4 /100 | #256 | Tragic 13.7% |
| Immigrants | Central America | 0.3 /100 | #257 | Tragic 13.8% |
| Immigrants | Guatemala | 0.3 /100 | #258 | Tragic 13.8% |
| Guatemalans | 0.3 /100 | #259 | Tragic 13.8% |
| Swiss | 0.3 /100 | #260 | Tragic 13.8% |
| Hungarians | 0.3 /100 | #261 | Tragic 13.8% |
| Fijians | 0.3 /100 | #262 | Tragic 13.8% |
| Cape Verdeans | 0.2 /100 | #263 | Tragic 13.8% |
| West Indians | 0.2 /100 | #264 | Tragic 13.8% |
| Immigrants | Congo | 0.2 /100 | #265 | Tragic 13.9% |
| Immigrants | Cabo Verde | 0.1 /100 | #266 | Tragic 13.9% |
| Germans | 0.1 /100 | #267 | Tragic 13.9% |
| Immigrants | Mexico | 0.1 /100 | #268 | Tragic 13.9% |
| Scottish | 0.1 /100 | #269 | Tragic 14.0% |
| Immigrants | Saudi Arabia | 0.1 /100 | #270 | Tragic 14.0% |
| Irish | 0.1 /100 | #271 | Tragic 14.0% |
| Mexicans | 0.1 /100 | #272 | Tragic 14.0% |
| Welsh | 0.1 /100 | #273 | Tragic 14.0% |
| Hondurans | 0.1 /100 | #274 | Tragic 14.0% |