Immigrants from Belarus vs Asian Single Female Poverty
COMPARE
Immigrants from Belarus
Asian
Single Female Poverty
Single Female Poverty Comparison
Immigrants from Belarus
Asians
19.3%
SINGLE FEMALE POVERTY
99.4/ 100
METRIC RATING
74th/ 347
METRIC RANK
18.3%
SINGLE FEMALE POVERTY
100.0/ 100
METRIC RATING
23rd/ 347
METRIC RANK
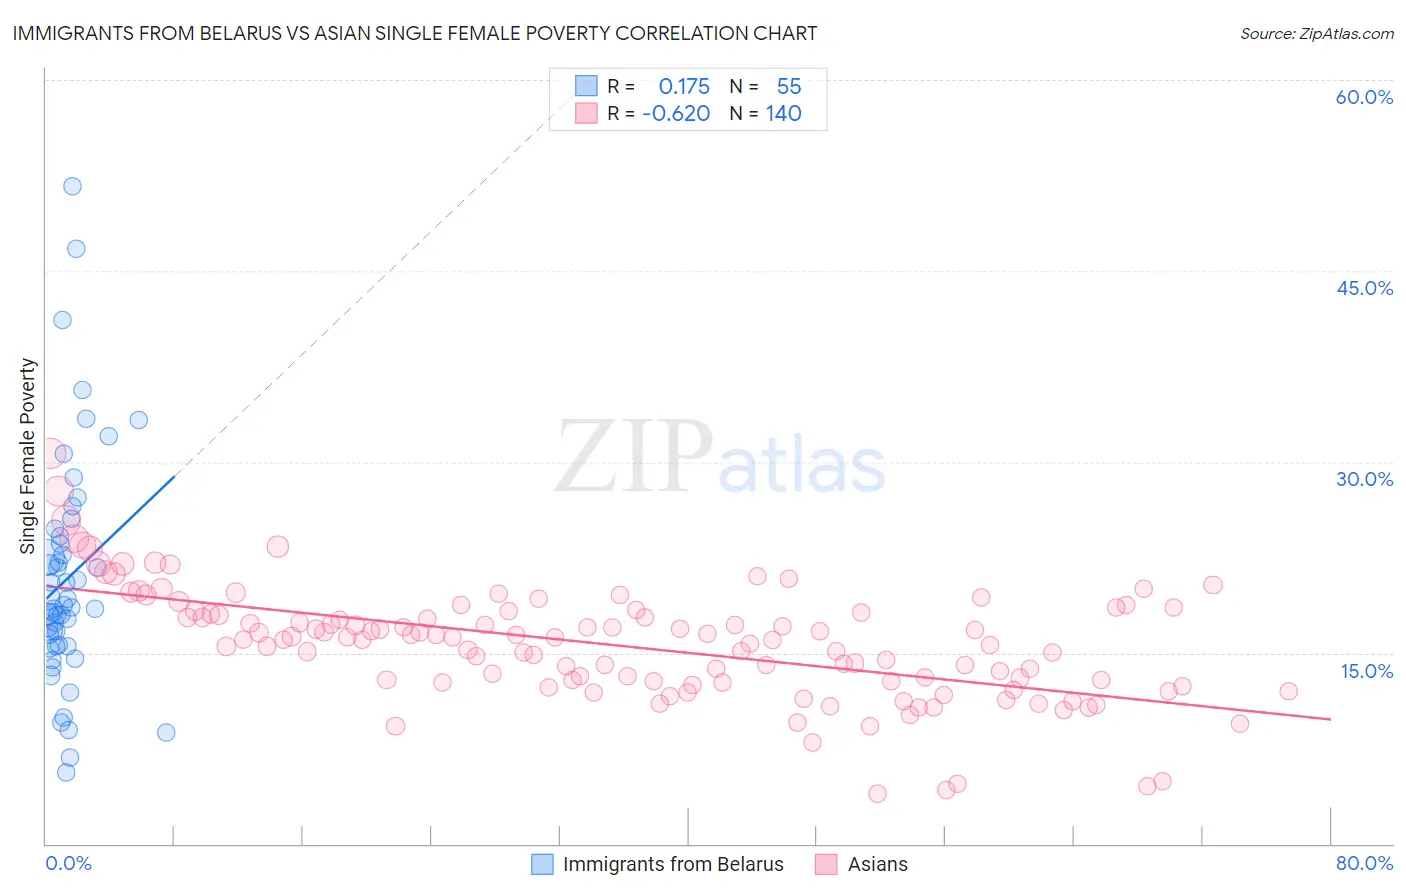
Immigrants from Belarus vs Asian Single Female Poverty Correlation Chart
The statistical analysis conducted on geographies consisting of 149,021,334 people shows a poor positive correlation between the proportion of Immigrants from Belarus and poverty level among single females in the United States with a correlation coefficient (R) of 0.175 and weighted average of 19.3%. Similarly, the statistical analysis conducted on geographies consisting of 534,134,882 people shows a significant negative correlation between the proportion of Asians and poverty level among single females in the United States with a correlation coefficient (R) of -0.620 and weighted average of 18.3%, a difference of 5.8%.
Single Female Poverty Correlation Summary
| Measurement | Immigrants from Belarus | Asian |
| Minimum | 5.6% | 3.9% |
| Maximum | 51.6% | 30.6% |
| Range | 46.1% | 26.7% |
| Mean | 20.8% | 15.6% |
| Median | 18.5% | 16.0% |
| Interquartile 25% (IQ1) | 15.5% | 12.7% |
| Interquartile 75% (IQ3) | 24.1% | 18.1% |
| Interquartile Range (IQR) | 8.6% | 5.4% |
| Standard Deviation (Sample) | 9.1% | 4.4% |
| Standard Deviation (Population) | 9.0% | 4.4% |
Similar Demographics by Single Female Poverty
Demographics Similar to Immigrants from Belarus by Single Female Poverty
In terms of single female poverty, the demographic groups most similar to Immigrants from Belarus are Immigrants from Peru (19.3%, a difference of 0.010%), Immigrants from Turkey (19.4%, a difference of 0.040%), Peruvian (19.4%, a difference of 0.070%), Immigrants from Latvia (19.3%, a difference of 0.11%), and Immigrants from South Eastern Asia (19.3%, a difference of 0.12%).
| Demographics | Rating | Rank | Single Female Poverty |
| Immigrants | Egypt | 99.6 /100 | #67 | Exceptional 19.2% |
| Laotians | 99.5 /100 | #68 | Exceptional 19.3% |
| Paraguayans | 99.5 /100 | #69 | Exceptional 19.3% |
| Immigrants | Jordan | 99.4 /100 | #70 | Exceptional 19.3% |
| Immigrants | South Eastern Asia | 99.4 /100 | #71 | Exceptional 19.3% |
| Immigrants | Latvia | 99.4 /100 | #72 | Exceptional 19.3% |
| Immigrants | Peru | 99.4 /100 | #73 | Exceptional 19.3% |
| Immigrants | Belarus | 99.4 /100 | #74 | Exceptional 19.3% |
| Immigrants | Turkey | 99.4 /100 | #75 | Exceptional 19.4% |
| Peruvians | 99.4 /100 | #76 | Exceptional 19.4% |
| Immigrants | Russia | 99.3 /100 | #77 | Exceptional 19.4% |
| Albanians | 99.3 /100 | #78 | Exceptional 19.4% |
| Immigrants | Sierra Leone | 99.3 /100 | #79 | Exceptional 19.4% |
| Immigrants | Australia | 99.3 /100 | #80 | Exceptional 19.4% |
| Immigrants | Scotland | 99.2 /100 | #81 | Exceptional 19.4% |
Demographics Similar to Asians by Single Female Poverty
In terms of single female poverty, the demographic groups most similar to Asians are Burmese (18.3%, a difference of 0.0%), Maltese (18.3%, a difference of 0.020%), Immigrants from Greece (18.3%, a difference of 0.070%), Armenian (18.3%, a difference of 0.23%), and Immigrants from Singapore (18.3%, a difference of 0.33%).
| Demographics | Rating | Rank | Single Female Poverty |
| Iranians | 100.0 /100 | #16 | Exceptional 18.0% |
| Immigrants | Korea | 100.0 /100 | #17 | Exceptional 18.1% |
| Immigrants | Eastern Asia | 100.0 /100 | #18 | Exceptional 18.1% |
| Immigrants | China | 100.0 /100 | #19 | Exceptional 18.1% |
| Immigrants | Greece | 100.0 /100 | #20 | Exceptional 18.3% |
| Maltese | 100.0 /100 | #21 | Exceptional 18.3% |
| Burmese | 100.0 /100 | #22 | Exceptional 18.3% |
| Asians | 100.0 /100 | #23 | Exceptional 18.3% |
| Armenians | 100.0 /100 | #24 | Exceptional 18.3% |
| Immigrants | Singapore | 100.0 /100 | #25 | Exceptional 18.3% |
| Immigrants | Israel | 100.0 /100 | #26 | Exceptional 18.3% |
| Immigrants | Pakistan | 100.0 /100 | #27 | Exceptional 18.4% |
| Immigrants | Moldova | 100.0 /100 | #28 | Exceptional 18.5% |
| Immigrants | Poland | 100.0 /100 | #29 | Exceptional 18.5% |
| Immigrants | North Macedonia | 99.9 /100 | #30 | Exceptional 18.5% |