Immigrants from Barbados vs Immigrants from Trinidad and Tobago Child Poverty Under the Age of 16
COMPARE
Immigrants from Barbados
Immigrants from Trinidad and Tobago
Child Poverty Under the Age of 16
Child Poverty Under the Age of 16 Comparison
Immigrants from Barbados
Immigrants from Trinidad and Tobago
19.9%
CHILD POVERTY UNDER THE AGE OF 16
0.1/ 100
METRIC RATING
275th/ 347
METRIC RANK
19.1%
CHILD POVERTY UNDER THE AGE OF 16
0.3/ 100
METRIC RATING
252nd/ 347
METRIC RANK
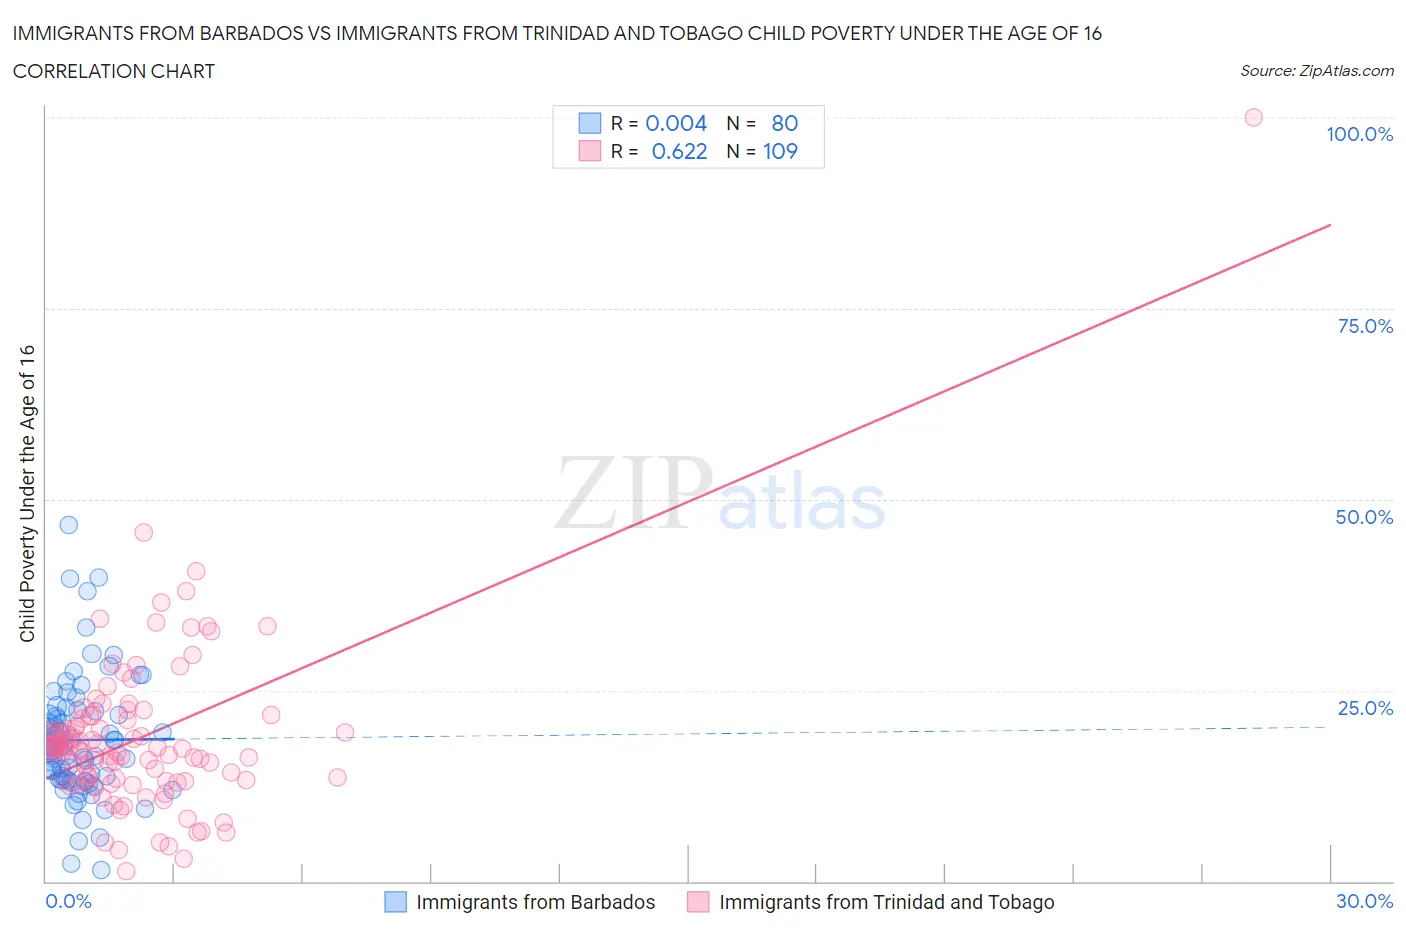
Immigrants from Barbados vs Immigrants from Trinidad and Tobago Child Poverty Under the Age of 16 Correlation Chart
The statistical analysis conducted on geographies consisting of 112,587,035 people shows no correlation between the proportion of Immigrants from Barbados and poverty level among children under the age of 16 in the United States with a correlation coefficient (R) of 0.004 and weighted average of 19.9%. Similarly, the statistical analysis conducted on geographies consisting of 222,555,778 people shows a significant positive correlation between the proportion of Immigrants from Trinidad and Tobago and poverty level among children under the age of 16 in the United States with a correlation coefficient (R) of 0.622 and weighted average of 19.1%, a difference of 4.1%.
Child Poverty Under the Age of 16 Correlation Summary
| Measurement | Immigrants from Barbados | Immigrants from Trinidad and Tobago |
| Minimum | 1.6% | 1.3% |
| Maximum | 46.7% | 100.0% |
| Range | 45.2% | 98.7% |
| Mean | 18.5% | 18.8% |
| Median | 17.5% | 17.4% |
| Interquartile 25% (IQ1) | 13.3% | 13.2% |
| Interquartile 75% (IQ3) | 22.0% | 21.5% |
| Interquartile Range (IQR) | 8.7% | 8.3% |
| Standard Deviation (Sample) | 8.1% | 11.3% |
| Standard Deviation (Population) | 8.0% | 11.2% |
Similar Demographics by Child Poverty Under the Age of 16
Demographics Similar to Immigrants from Barbados by Child Poverty Under the Age of 16
In terms of child poverty under the age of 16, the demographic groups most similar to Immigrants from Barbados are Immigrants from Cabo Verde (19.9%, a difference of 0.0%), Belizean (19.9%, a difference of 0.0%), Iroquois (19.9%, a difference of 0.14%), Immigrants from Jamaica (19.8%, a difference of 0.16%), and Bangladeshi (19.9%, a difference of 0.24%).
| Demographics | Rating | Rank | Child Poverty Under the Age of 16 |
| Jamaicans | 0.1 /100 | #268 | Tragic 19.7% |
| Immigrants | El Salvador | 0.1 /100 | #269 | Tragic 19.7% |
| Spanish American Indians | 0.1 /100 | #270 | Tragic 19.7% |
| Immigrants | Liberia | 0.1 /100 | #271 | Tragic 19.7% |
| Immigrants | Bangladesh | 0.1 /100 | #272 | Tragic 19.8% |
| Immigrants | Jamaica | 0.1 /100 | #273 | Tragic 19.8% |
| Immigrants | Cabo Verde | 0.1 /100 | #274 | Tragic 19.9% |
| Immigrants | Barbados | 0.1 /100 | #275 | Tragic 19.9% |
| Belizeans | 0.1 /100 | #276 | Tragic 19.9% |
| Iroquois | 0.1 /100 | #277 | Tragic 19.9% |
| Bangladeshis | 0.0 /100 | #278 | Tragic 19.9% |
| Sub-Saharan Africans | 0.0 /100 | #279 | Tragic 19.9% |
| Comanche | 0.0 /100 | #280 | Tragic 19.9% |
| Central Americans | 0.0 /100 | #281 | Tragic 20.0% |
| Barbadians | 0.0 /100 | #282 | Tragic 20.0% |
Demographics Similar to Immigrants from Trinidad and Tobago by Child Poverty Under the Age of 16
In terms of child poverty under the age of 16, the demographic groups most similar to Immigrants from Trinidad and Tobago are Immigrants from Ghana (19.1%, a difference of 0.070%), Salvadoran (19.1%, a difference of 0.19%), Immigrants from Middle Africa (19.0%, a difference of 0.23%), Potawatomi (19.0%, a difference of 0.43%), and Immigrants from Western Africa (19.2%, a difference of 0.44%).
| Demographics | Rating | Rank | Child Poverty Under the Age of 16 |
| Shoshone | 0.5 /100 | #245 | Tragic 18.8% |
| Immigrants | Nicaragua | 0.4 /100 | #246 | Tragic 18.8% |
| French American Indians | 0.4 /100 | #247 | Tragic 18.9% |
| Ecuadorians | 0.3 /100 | #248 | Tragic 19.0% |
| Potawatomi | 0.3 /100 | #249 | Tragic 19.0% |
| Immigrants | Middle Africa | 0.3 /100 | #250 | Tragic 19.0% |
| Immigrants | Ghana | 0.3 /100 | #251 | Tragic 19.1% |
| Immigrants | Trinidad and Tobago | 0.3 /100 | #252 | Tragic 19.1% |
| Salvadorans | 0.3 /100 | #253 | Tragic 19.1% |
| Immigrants | Western Africa | 0.2 /100 | #254 | Tragic 19.2% |
| Trinidadians and Tobagonians | 0.2 /100 | #255 | Tragic 19.2% |
| Inupiat | 0.2 /100 | #256 | Tragic 19.2% |
| Ottawa | 0.2 /100 | #257 | Tragic 19.2% |
| Spanish Americans | 0.2 /100 | #258 | Tragic 19.2% |
| Mexican American Indians | 0.2 /100 | #259 | Tragic 19.3% |