Immigrants from Bangladesh vs Immigrants from Netherlands Family Poverty
COMPARE
Immigrants from Bangladesh
Immigrants from Netherlands
Family Poverty
Family Poverty Comparison
Immigrants from Bangladesh
Immigrants from Netherlands
11.7%
FAMILY POVERTY
0.0/ 100
METRIC RATING
300th/ 347
METRIC RANK
7.7%
FAMILY POVERTY
98.6/ 100
METRIC RATING
61st/ 347
METRIC RANK
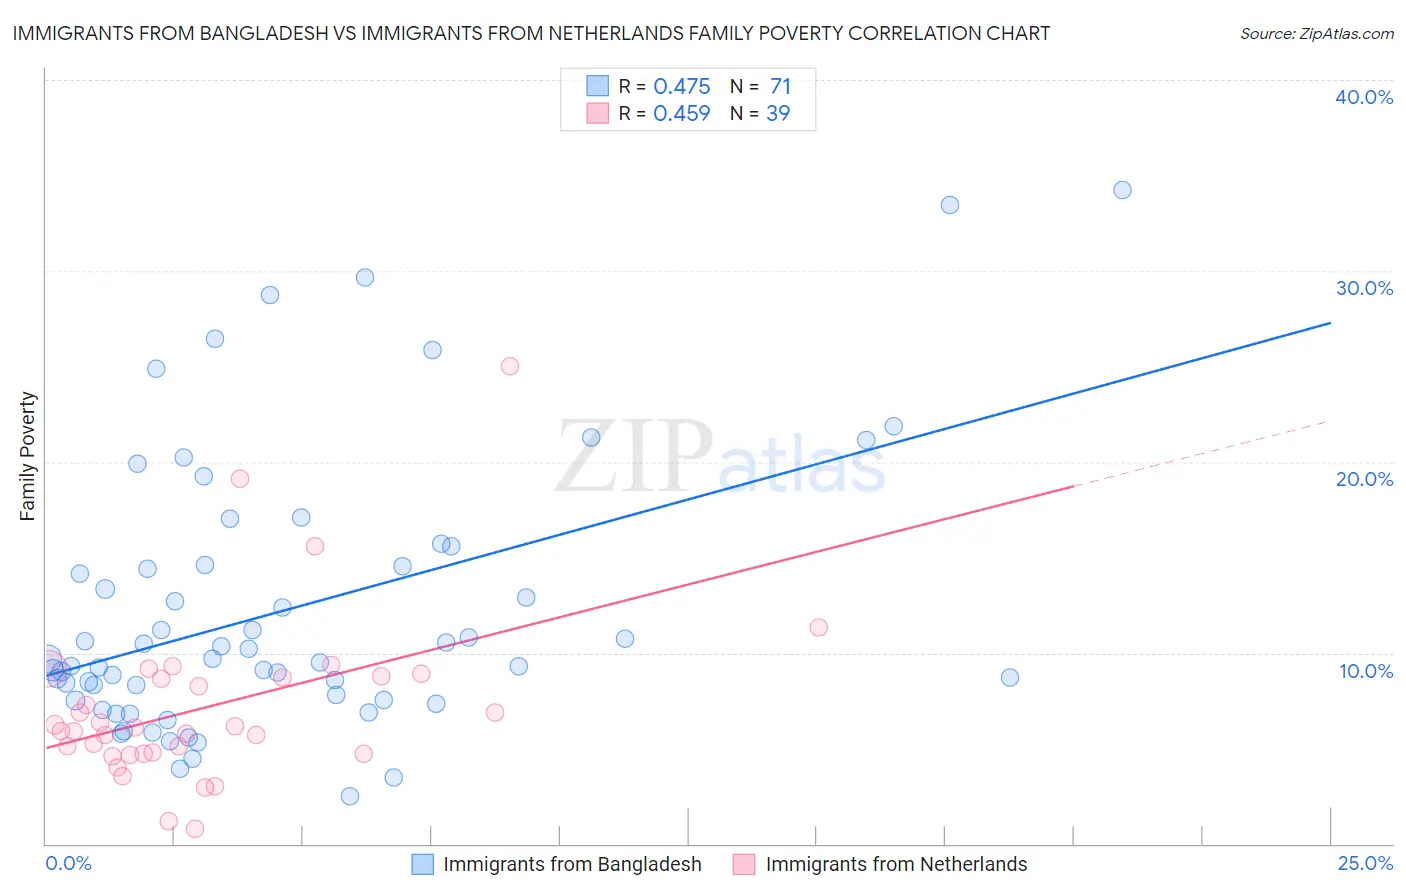
Immigrants from Bangladesh vs Immigrants from Netherlands Family Poverty Correlation Chart
The statistical analysis conducted on geographies consisting of 203,403,865 people shows a moderate positive correlation between the proportion of Immigrants from Bangladesh and poverty level among families in the United States with a correlation coefficient (R) of 0.475 and weighted average of 11.7%. Similarly, the statistical analysis conducted on geographies consisting of 237,430,105 people shows a moderate positive correlation between the proportion of Immigrants from Netherlands and poverty level among families in the United States with a correlation coefficient (R) of 0.459 and weighted average of 7.7%, a difference of 50.8%.
Family Poverty Correlation Summary
| Measurement | Immigrants from Bangladesh | Immigrants from Netherlands |
| Minimum | 2.5% | 0.78% |
| Maximum | 34.2% | 25.0% |
| Range | 31.7% | 24.2% |
| Mean | 12.3% | 7.2% |
| Median | 9.7% | 6.1% |
| Interquartile 25% (IQ1) | 7.5% | 4.7% |
| Interquartile 75% (IQ3) | 14.6% | 8.7% |
| Interquartile Range (IQR) | 7.1% | 4.0% |
| Standard Deviation (Sample) | 7.2% | 4.5% |
| Standard Deviation (Population) | 7.1% | 4.4% |
Similar Demographics by Family Poverty
Demographics Similar to Immigrants from Bangladesh by Family Poverty
In terms of family poverty, the demographic groups most similar to Immigrants from Bangladesh are Dutch West Indian (11.7%, a difference of 0.010%), Immigrants from Senegal (11.7%, a difference of 0.11%), Creek (11.7%, a difference of 0.25%), Bahamian (11.7%, a difference of 0.25%), and Guatemalan (11.7%, a difference of 0.29%).
| Demographics | Rating | Rank | Family Poverty |
| Immigrants | Cabo Verde | 0.0 /100 | #293 | Tragic 11.6% |
| Immigrants | St. Vincent and the Grenadines | 0.0 /100 | #294 | Tragic 11.6% |
| Immigrants | Haiti | 0.0 /100 | #295 | Tragic 11.6% |
| Choctaw | 0.0 /100 | #296 | Tragic 11.6% |
| Creek | 0.0 /100 | #297 | Tragic 11.7% |
| Immigrants | Senegal | 0.0 /100 | #298 | Tragic 11.7% |
| Dutch West Indians | 0.0 /100 | #299 | Tragic 11.7% |
| Immigrants | Bangladesh | 0.0 /100 | #300 | Tragic 11.7% |
| Bahamians | 0.0 /100 | #301 | Tragic 11.7% |
| Guatemalans | 0.0 /100 | #302 | Tragic 11.7% |
| Africans | 0.0 /100 | #303 | Tragic 11.8% |
| Immigrants | Latin America | 0.0 /100 | #304 | Tragic 11.8% |
| Mexicans | 0.0 /100 | #305 | Tragic 11.8% |
| Cajuns | 0.0 /100 | #306 | Tragic 11.9% |
| Immigrants | Congo | 0.0 /100 | #307 | Tragic 11.9% |
Demographics Similar to Immigrants from Netherlands by Family Poverty
In terms of family poverty, the demographic groups most similar to Immigrants from Netherlands are Immigrants from Greece (7.7%, a difference of 0.18%), European (7.7%, a difference of 0.19%), Macedonian (7.8%, a difference of 0.19%), Finnish (7.7%, a difference of 0.20%), and Asian (7.7%, a difference of 0.23%).
| Demographics | Rating | Rank | Family Poverty |
| Immigrants | Sweden | 98.8 /100 | #54 | Exceptional 7.7% |
| Immigrants | Eastern Asia | 98.7 /100 | #55 | Exceptional 7.7% |
| Immigrants | Serbia | 98.7 /100 | #56 | Exceptional 7.7% |
| Asians | 98.7 /100 | #57 | Exceptional 7.7% |
| Finns | 98.7 /100 | #58 | Exceptional 7.7% |
| Europeans | 98.7 /100 | #59 | Exceptional 7.7% |
| Immigrants | Greece | 98.7 /100 | #60 | Exceptional 7.7% |
| Immigrants | Netherlands | 98.6 /100 | #61 | Exceptional 7.7% |
| Macedonians | 98.6 /100 | #62 | Exceptional 7.8% |
| Zimbabweans | 98.4 /100 | #63 | Exceptional 7.8% |
| Koreans | 98.3 /100 | #64 | Exceptional 7.8% |
| Immigrants | Bulgaria | 98.3 /100 | #65 | Exceptional 7.8% |
| Dutch | 98.3 /100 | #66 | Exceptional 7.8% |
| Northern Europeans | 98.3 /100 | #67 | Exceptional 7.8% |
| Australians | 98.2 /100 | #68 | Exceptional 7.8% |