Immigrants from Bahamas vs Immigrants from Europe Female Poverty Among 25-34 Year Olds
COMPARE
Immigrants from Bahamas
Immigrants from Europe
Female Poverty Among 25-34 Year Olds
Female Poverty Among 25-34 Year Olds Comparison
Immigrants from Bahamas
Immigrants from Europe
16.3%
FEMALE POVERTY AMONG 25-34 YEAR OLDS
0.0/ 100
METRIC RATING
285th/ 347
METRIC RANK
12.2%
FEMALE POVERTY AMONG 25-34 YEAR OLDS
99.2/ 100
METRIC RATING
66th/ 347
METRIC RANK
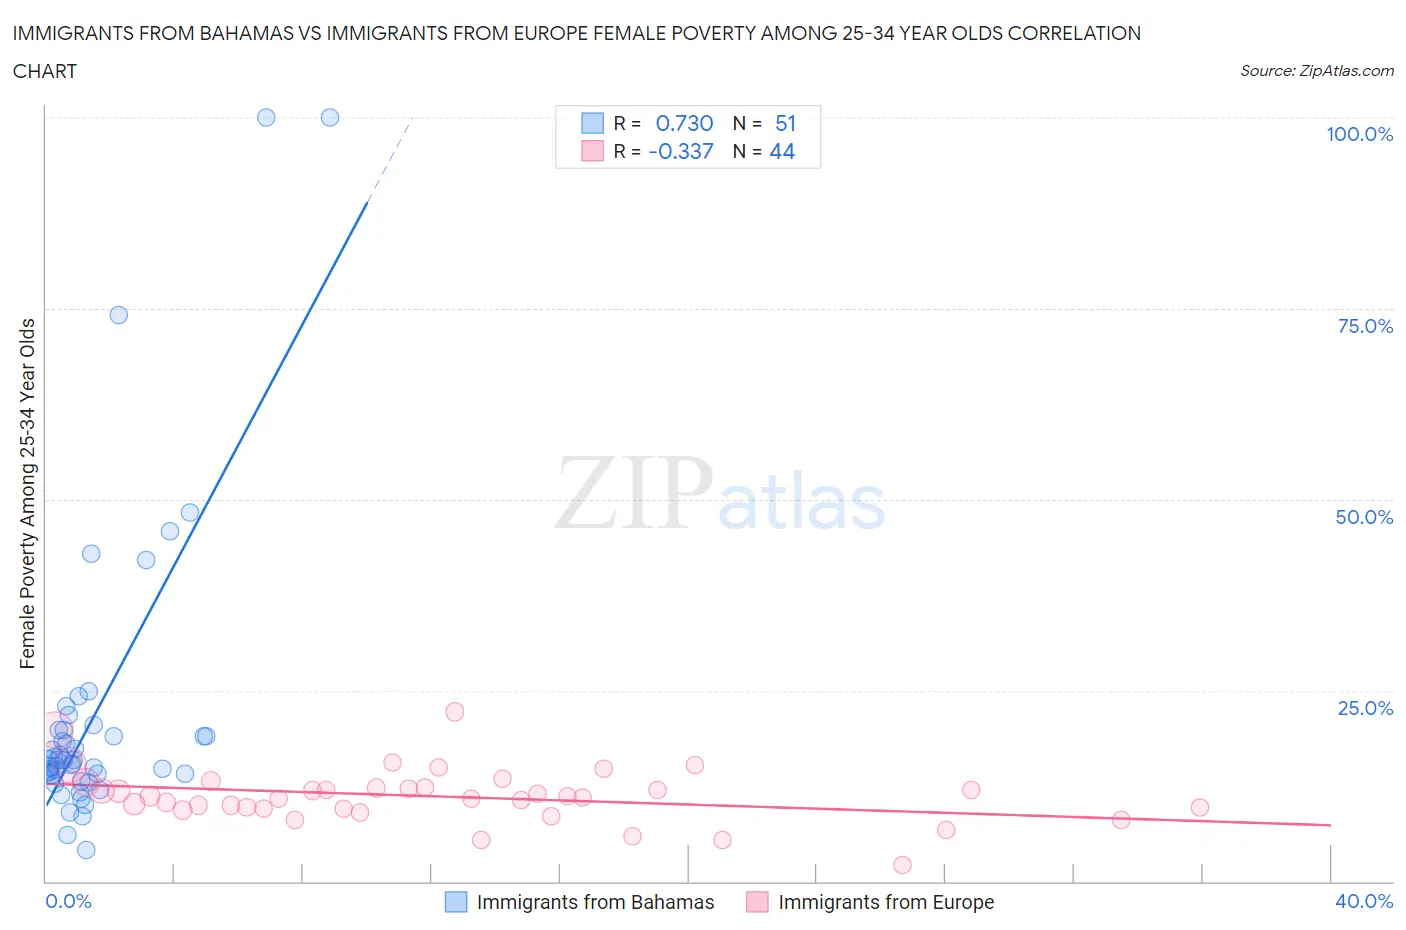
Immigrants from Bahamas vs Immigrants from Europe Female Poverty Among 25-34 Year Olds Correlation Chart
The statistical analysis conducted on geographies consisting of 104,297,091 people shows a strong positive correlation between the proportion of Immigrants from Bahamas and poverty level among females between the ages 25 and 34 in the United States with a correlation coefficient (R) of 0.730 and weighted average of 16.3%. Similarly, the statistical analysis conducted on geographies consisting of 529,126,635 people shows a mild negative correlation between the proportion of Immigrants from Europe and poverty level among females between the ages 25 and 34 in the United States with a correlation coefficient (R) of -0.337 and weighted average of 12.2%, a difference of 34.1%.
Female Poverty Among 25-34 Year Olds Correlation Summary
| Measurement | Immigrants from Bahamas | Immigrants from Europe |
| Minimum | 4.0% | 2.1% |
| Maximum | 100.0% | 22.2% |
| Range | 96.0% | 20.0% |
| Mean | 22.1% | 11.1% |
| Median | 15.8% | 11.0% |
| Interquartile 25% (IQ1) | 13.9% | 9.5% |
| Interquartile 75% (IQ3) | 19.9% | 12.3% |
| Interquartile Range (IQR) | 5.9% | 2.8% |
| Standard Deviation (Sample) | 19.9% | 3.5% |
| Standard Deviation (Population) | 19.7% | 3.5% |
Similar Demographics by Female Poverty Among 25-34 Year Olds
Demographics Similar to Immigrants from Bahamas by Female Poverty Among 25-34 Year Olds
In terms of female poverty among 25-34 year olds, the demographic groups most similar to Immigrants from Bahamas are Cape Verdean (16.3%, a difference of 0.18%), American (16.4%, a difference of 0.23%), Guatemalan (16.4%, a difference of 0.42%), Osage (16.4%, a difference of 0.48%), and Shoshone (16.2%, a difference of 0.50%).
| Demographics | Rating | Rank | Female Poverty Among 25-34 Year Olds |
| French American Indians | 0.0 /100 | #278 | Tragic 15.9% |
| Fijians | 0.0 /100 | #279 | Tragic 15.9% |
| Bangladeshis | 0.0 /100 | #280 | Tragic 15.9% |
| Immigrants | Latin America | 0.0 /100 | #281 | Tragic 16.0% |
| Aleuts | 0.0 /100 | #282 | Tragic 16.1% |
| Bahamians | 0.0 /100 | #283 | Tragic 16.1% |
| Shoshone | 0.0 /100 | #284 | Tragic 16.2% |
| Immigrants | Bahamas | 0.0 /100 | #285 | Tragic 16.3% |
| Cape Verdeans | 0.0 /100 | #286 | Tragic 16.3% |
| Americans | 0.0 /100 | #287 | Tragic 16.4% |
| Guatemalans | 0.0 /100 | #288 | Tragic 16.4% |
| Osage | 0.0 /100 | #289 | Tragic 16.4% |
| Indonesians | 0.0 /100 | #290 | Tragic 16.4% |
| Comanche | 0.0 /100 | #291 | Tragic 16.5% |
| Immigrants | Dominica | 0.0 /100 | #292 | Tragic 16.5% |
Demographics Similar to Immigrants from Europe by Female Poverty Among 25-34 Year Olds
In terms of female poverty among 25-34 year olds, the demographic groups most similar to Immigrants from Europe are Armenian (12.2%, a difference of 0.060%), Immigrants from Russia (12.2%, a difference of 0.070%), Laotian (12.2%, a difference of 0.12%), Soviet Union (12.1%, a difference of 0.31%), and Immigrants from Moldova (12.1%, a difference of 0.32%).
| Demographics | Rating | Rank | Female Poverty Among 25-34 Year Olds |
| Russians | 99.4 /100 | #59 | Exceptional 12.1% |
| Immigrants | Northern Europe | 99.4 /100 | #60 | Exceptional 12.1% |
| Immigrants | Czechoslovakia | 99.4 /100 | #61 | Exceptional 12.1% |
| Immigrants | Moldova | 99.3 /100 | #62 | Exceptional 12.1% |
| Soviet Union | 99.3 /100 | #63 | Exceptional 12.1% |
| Immigrants | Russia | 99.2 /100 | #64 | Exceptional 12.2% |
| Armenians | 99.2 /100 | #65 | Exceptional 12.2% |
| Immigrants | Europe | 99.2 /100 | #66 | Exceptional 12.2% |
| Laotians | 99.2 /100 | #67 | Exceptional 12.2% |
| Sri Lankans | 99.1 /100 | #68 | Exceptional 12.2% |
| Immigrants | Lebanon | 99.1 /100 | #69 | Exceptional 12.2% |
| Immigrants | Belgium | 99.1 /100 | #70 | Exceptional 12.2% |
| Immigrants | Scotland | 99.1 /100 | #71 | Exceptional 12.2% |
| Lithuanians | 99.1 /100 | #72 | Exceptional 12.2% |
| Immigrants | Vietnam | 98.9 /100 | #73 | Exceptional 12.3% |