Immigrants from Australia vs Paraguayan Single Father Poverty
COMPARE
Immigrants from Australia
Paraguayan
Single Father Poverty
Single Father Poverty Comparison
Immigrants from Australia
Paraguayans
15.7%
SINGLE FATHER POVERTY
96.1/ 100
METRIC RATING
105th/ 347
METRIC RANK
15.2%
SINGLE FATHER POVERTY
99.7/ 100
METRIC RATING
67th/ 347
METRIC RANK
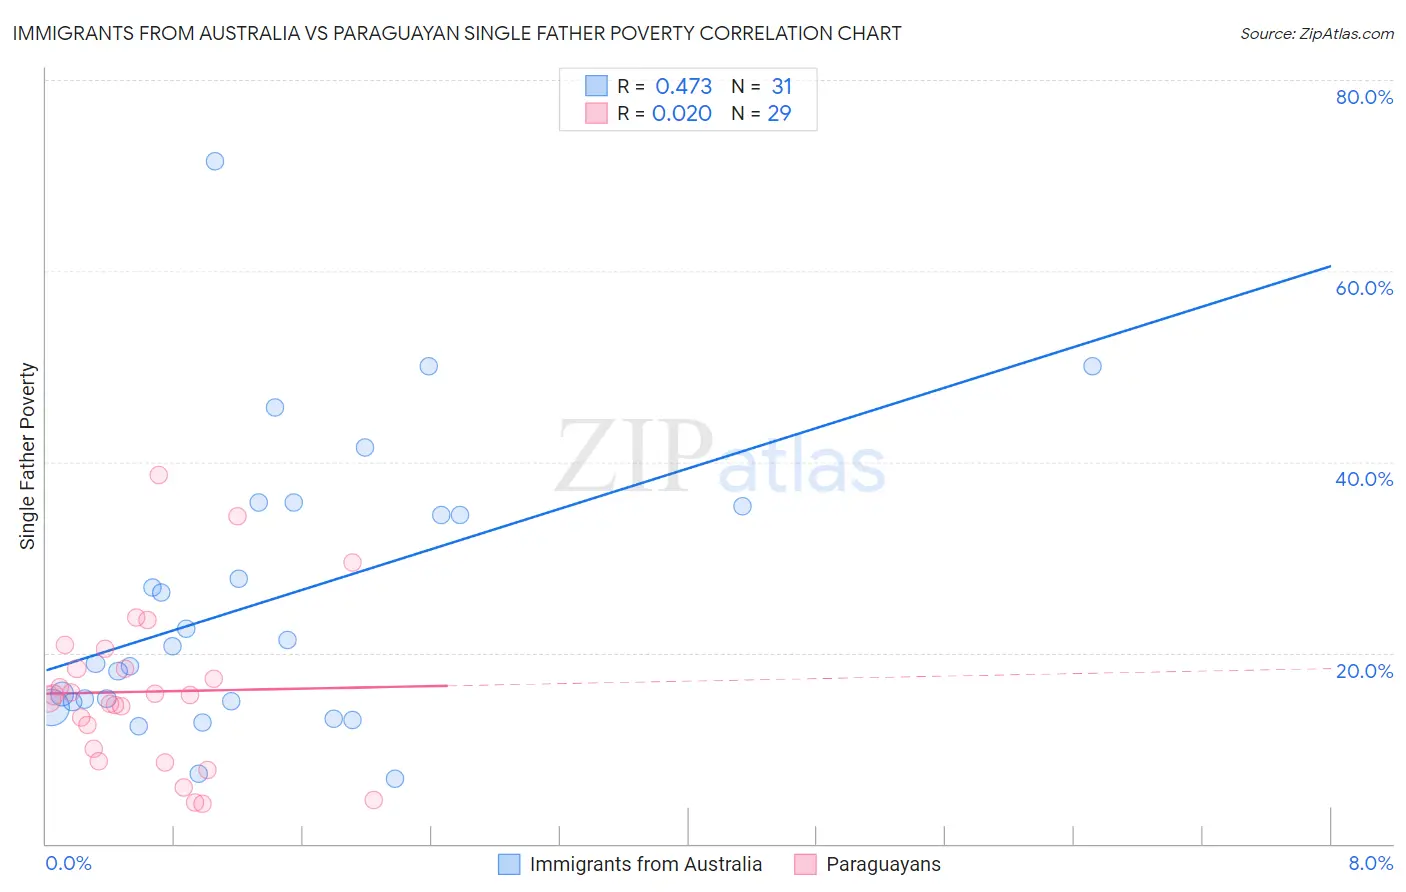
Immigrants from Australia vs Paraguayan Single Father Poverty Correlation Chart
The statistical analysis conducted on geographies consisting of 187,295,963 people shows a moderate positive correlation between the proportion of Immigrants from Australia and poverty level among single fathers in the United States with a correlation coefficient (R) of 0.473 and weighted average of 15.7%. Similarly, the statistical analysis conducted on geographies consisting of 86,793,016 people shows no correlation between the proportion of Paraguayans and poverty level among single fathers in the United States with a correlation coefficient (R) of 0.020 and weighted average of 15.2%, a difference of 3.3%.
Single Father Poverty Correlation Summary
| Measurement | Immigrants from Australia | Paraguayan |
| Minimum | 6.8% | 4.2% |
| Maximum | 71.5% | 38.6% |
| Range | 64.7% | 34.4% |
| Mean | 25.5% | 15.9% |
| Median | 20.7% | 15.6% |
| Interquartile 25% (IQ1) | 14.9% | 9.3% |
| Interquartile 75% (IQ3) | 35.3% | 19.4% |
| Interquartile Range (IQR) | 20.4% | 10.1% |
| Standard Deviation (Sample) | 14.9% | 8.3% |
| Standard Deviation (Population) | 14.6% | 8.2% |
Similar Demographics by Single Father Poverty
Demographics Similar to Immigrants from Australia by Single Father Poverty
In terms of single father poverty, the demographic groups most similar to Immigrants from Australia are Australian (15.7%, a difference of 0.010%), South American Indian (15.7%, a difference of 0.030%), Immigrants from Poland (15.7%, a difference of 0.070%), Native Hawaiian (15.7%, a difference of 0.090%), and Chilean (15.7%, a difference of 0.10%).
| Demographics | Rating | Rank | Single Father Poverty |
| Zimbabweans | 98.1 /100 | #98 | Exceptional 15.6% |
| Immigrants | Middle Africa | 97.4 /100 | #99 | Exceptional 15.6% |
| Immigrants | Chile | 96.9 /100 | #100 | Exceptional 15.7% |
| Fijians | 96.8 /100 | #101 | Exceptional 15.7% |
| Chileans | 96.4 /100 | #102 | Exceptional 15.7% |
| South American Indians | 96.2 /100 | #103 | Exceptional 15.7% |
| Australians | 96.1 /100 | #104 | Exceptional 15.7% |
| Immigrants | Australia | 96.1 /100 | #105 | Exceptional 15.7% |
| Immigrants | Poland | 95.8 /100 | #106 | Exceptional 15.7% |
| Native Hawaiians | 95.8 /100 | #107 | Exceptional 15.7% |
| Pakistanis | 95.7 /100 | #108 | Exceptional 15.7% |
| Turks | 95.1 /100 | #109 | Exceptional 15.8% |
| Immigrants | Africa | 95.1 /100 | #110 | Exceptional 15.8% |
| Bulgarians | 94.8 /100 | #111 | Exceptional 15.8% |
| Immigrants | Latvia | 94.7 /100 | #112 | Exceptional 15.8% |
Demographics Similar to Paraguayans by Single Father Poverty
In terms of single father poverty, the demographic groups most similar to Paraguayans are Immigrants from Moldova (15.2%, a difference of 0.090%), Immigrants from Cameroon (15.2%, a difference of 0.090%), Immigrants from Malaysia (15.2%, a difference of 0.11%), Japanese (15.2%, a difference of 0.11%), and Bangladeshi (15.2%, a difference of 0.20%).
| Demographics | Rating | Rank | Single Father Poverty |
| Puget Sound Salish | 99.8 /100 | #60 | Exceptional 15.2% |
| Immigrants | Bosnia and Herzegovina | 99.8 /100 | #61 | Exceptional 15.2% |
| Immigrants | Armenia | 99.8 /100 | #62 | Exceptional 15.2% |
| Immigrants | Sweden | 99.8 /100 | #63 | Exceptional 15.2% |
| Bangladeshis | 99.8 /100 | #64 | Exceptional 15.2% |
| Immigrants | Malaysia | 99.8 /100 | #65 | Exceptional 15.2% |
| Immigrants | Moldova | 99.8 /100 | #66 | Exceptional 15.2% |
| Paraguayans | 99.7 /100 | #67 | Exceptional 15.2% |
| Immigrants | Cameroon | 99.7 /100 | #68 | Exceptional 15.2% |
| Japanese | 99.7 /100 | #69 | Exceptional 15.2% |
| Mongolians | 99.7 /100 | #70 | Exceptional 15.3% |
| Immigrants | Brazil | 99.6 /100 | #71 | Exceptional 15.3% |
| Immigrants | Lithuania | 99.6 /100 | #72 | Exceptional 15.3% |
| Kenyans | 99.6 /100 | #73 | Exceptional 15.3% |
| Maltese | 99.6 /100 | #74 | Exceptional 15.3% |