Immigrants from Australia vs Pakistani Single Male Poverty
COMPARE
Immigrants from Australia
Pakistani
Single Male Poverty
Single Male Poverty Comparison
Immigrants from Australia
Pakistanis
12.2%
SINGLE MALE POVERTY
97.1/ 100
METRIC RATING
100th/ 347
METRIC RANK
12.4%
SINGLE MALE POVERTY
92.4/ 100
METRIC RATING
113th/ 347
METRIC RANK
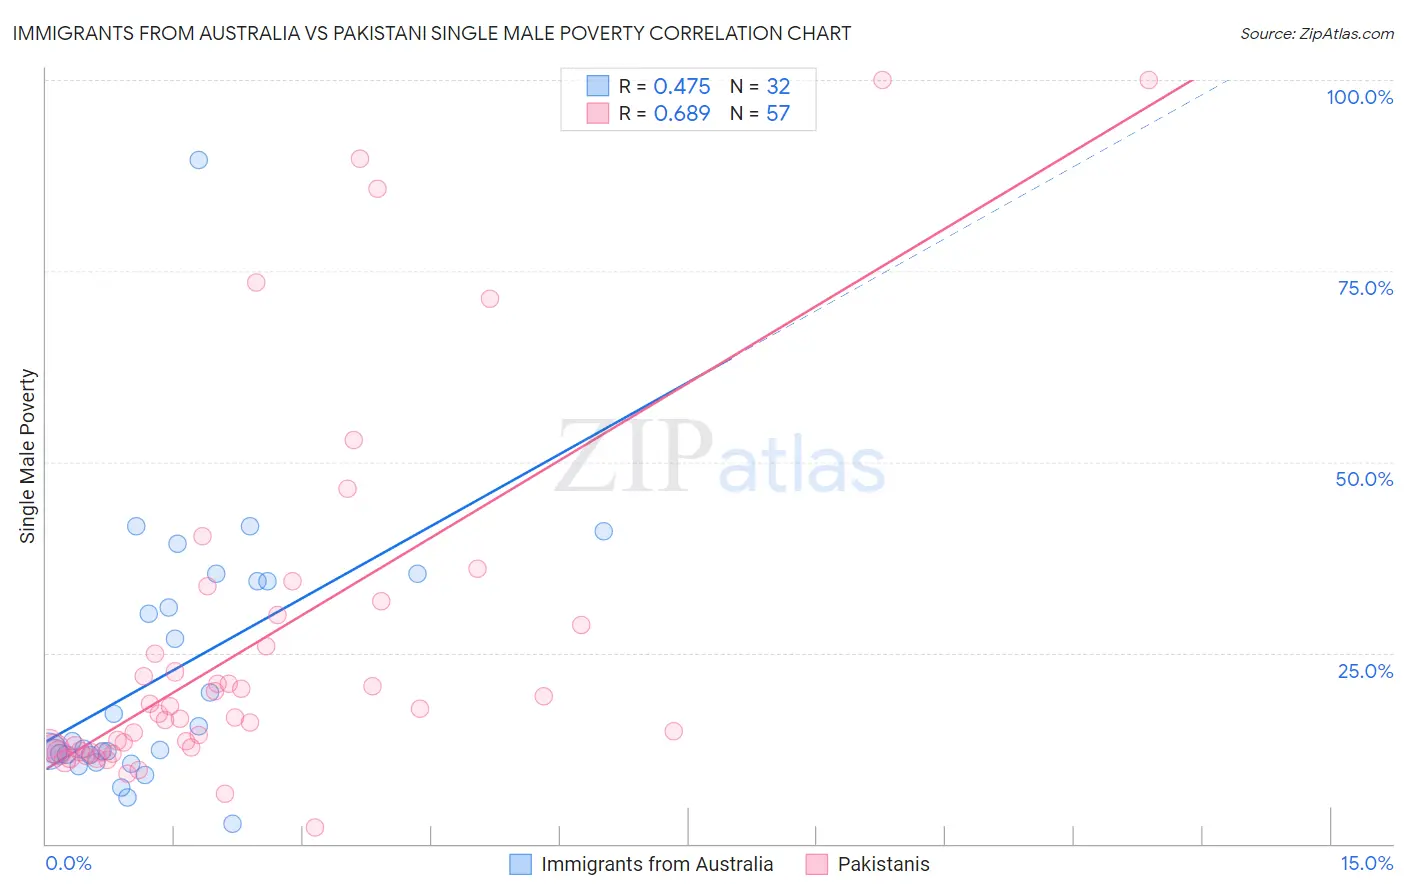
Immigrants from Australia vs Pakistani Single Male Poverty Correlation Chart
The statistical analysis conducted on geographies consisting of 206,372,420 people shows a moderate positive correlation between the proportion of Immigrants from Australia and poverty level among single males in the United States with a correlation coefficient (R) of 0.475 and weighted average of 12.2%. Similarly, the statistical analysis conducted on geographies consisting of 304,084,454 people shows a significant positive correlation between the proportion of Pakistanis and poverty level among single males in the United States with a correlation coefficient (R) of 0.689 and weighted average of 12.4%, a difference of 1.4%.
Single Male Poverty Correlation Summary
| Measurement | Immigrants from Australia | Pakistani |
| Minimum | 2.6% | 2.1% |
| Maximum | 89.5% | 100.0% |
| Range | 86.9% | 97.9% |
| Mean | 22.2% | 26.1% |
| Median | 12.9% | 17.0% |
| Interquartile 25% (IQ1) | 11.6% | 12.3% |
| Interquartile 75% (IQ3) | 34.4% | 29.3% |
| Interquartile Range (IQR) | 22.8% | 17.0% |
| Standard Deviation (Sample) | 17.3% | 23.4% |
| Standard Deviation (Population) | 17.0% | 23.2% |
Demographics Similar to Immigrants from Australia and Pakistanis by Single Male Poverty
In terms of single male poverty, the demographic groups most similar to Immigrants from Australia are Immigrants from Latvia (12.2%, a difference of 0.030%), Immigrants from Europe (12.2%, a difference of 0.040%), Immigrants from Cuba (12.2%, a difference of 0.11%), Guamanian/Chamorro (12.2%, a difference of 0.15%), and Immigrants from Italy (12.2%, a difference of 0.16%). Similarly, the demographic groups most similar to Pakistanis are Nicaraguan (12.4%, a difference of 0.050%), Immigrants from Southern Europe (12.4%, a difference of 0.15%), Kenyan (12.4%, a difference of 0.19%), Immigrants from Syria (12.4%, a difference of 0.21%), and Immigrants from North Macedonia (12.3%, a difference of 0.25%).
| Demographics | Rating | Rank | Single Male Poverty |
| Immigrants | Sweden | 97.5 /100 | #96 | Exceptional 12.2% |
| Immigrants | Italy | 97.4 /100 | #97 | Exceptional 12.2% |
| Guamanians/Chamorros | 97.4 /100 | #98 | Exceptional 12.2% |
| Immigrants | Cuba | 97.3 /100 | #99 | Exceptional 12.2% |
| Immigrants | Australia | 97.1 /100 | #100 | Exceptional 12.2% |
| Immigrants | Latvia | 97.0 /100 | #101 | Exceptional 12.2% |
| Immigrants | Europe | 97.0 /100 | #102 | Exceptional 12.2% |
| Immigrants | Armenia | 96.7 /100 | #103 | Exceptional 12.2% |
| Immigrants | Kazakhstan | 96.7 /100 | #104 | Exceptional 12.2% |
| Jordanians | 95.9 /100 | #105 | Exceptional 12.3% |
| Immigrants | Morocco | 95.6 /100 | #106 | Exceptional 12.3% |
| Iraqis | 95.1 /100 | #107 | Exceptional 12.3% |
| Immigrants | Eastern Africa | 95.0 /100 | #108 | Exceptional 12.3% |
| Ugandans | 94.5 /100 | #109 | Exceptional 12.3% |
| Immigrants | Portugal | 93.6 /100 | #110 | Exceptional 12.3% |
| Immigrants | North Macedonia | 93.6 /100 | #111 | Exceptional 12.3% |
| Kenyans | 93.3 /100 | #112 | Exceptional 12.4% |
| Pakistanis | 92.4 /100 | #113 | Exceptional 12.4% |
| Nicaraguans | 92.1 /100 | #114 | Exceptional 12.4% |
| Immigrants | Southern Europe | 91.5 /100 | #115 | Exceptional 12.4% |
| Immigrants | Syria | 91.2 /100 | #116 | Exceptional 12.4% |