Immigrants from Asia vs French American Indian Male Poverty
COMPARE
Immigrants from Asia
French American Indian
Male Poverty
Male Poverty Comparison
Immigrants from Asia
French American Indians
10.2%
MALE POVERTY
97.0/ 100
METRIC RATING
73rd/ 347
METRIC RANK
12.7%
MALE POVERTY
0.4/ 100
METRIC RATING
237th/ 347
METRIC RANK
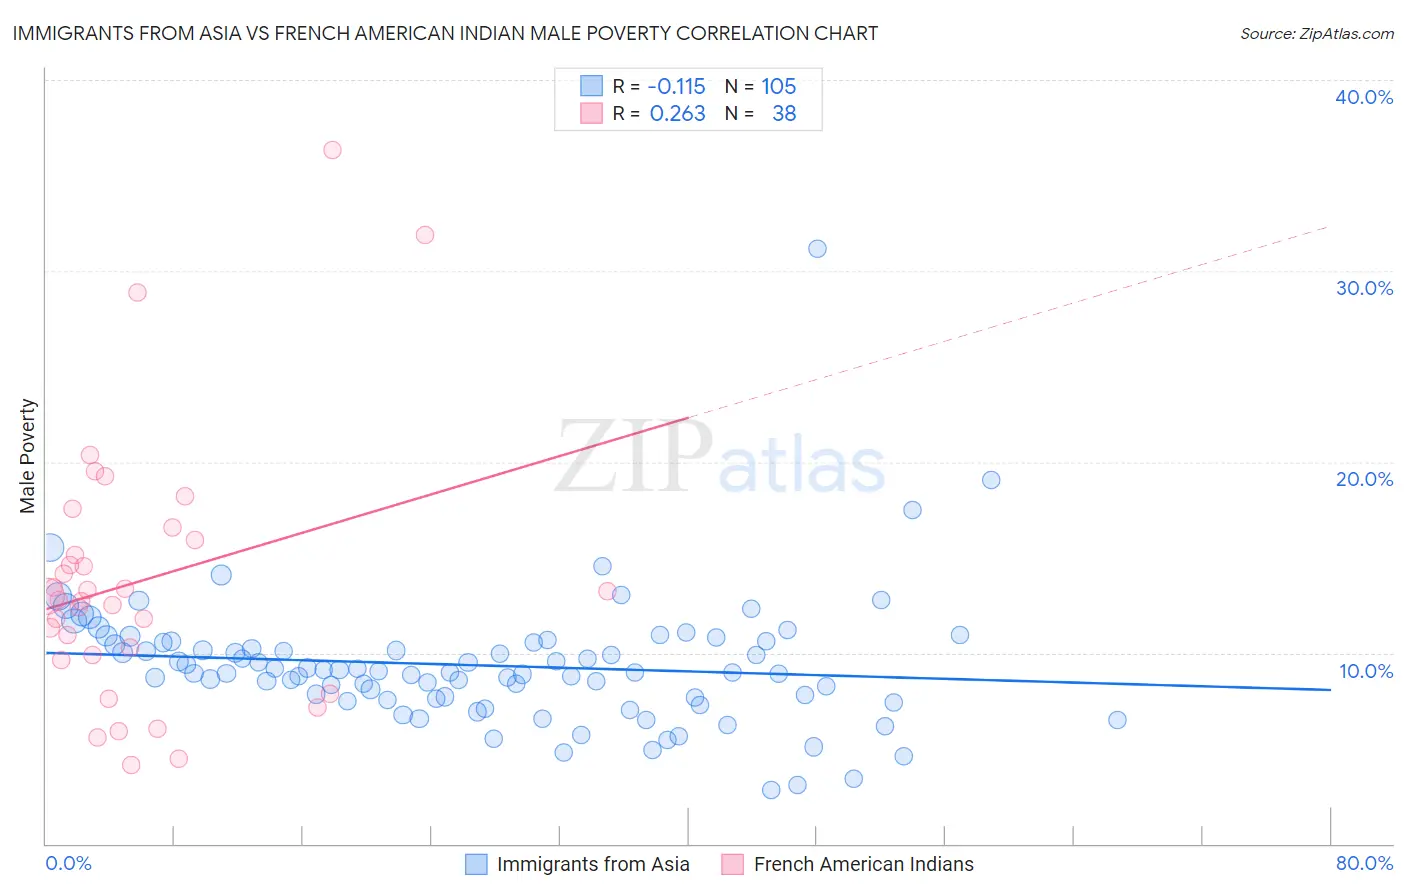
Immigrants from Asia vs French American Indian Male Poverty Correlation Chart
The statistical analysis conducted on geographies consisting of 547,932,841 people shows a poor negative correlation between the proportion of Immigrants from Asia and poverty level among males in the United States with a correlation coefficient (R) of -0.115 and weighted average of 10.2%. Similarly, the statistical analysis conducted on geographies consisting of 131,954,359 people shows a weak positive correlation between the proportion of French American Indians and poverty level among males in the United States with a correlation coefficient (R) of 0.263 and weighted average of 12.7%, a difference of 23.8%.
Male Poverty Correlation Summary
| Measurement | Immigrants from Asia | French American Indian |
| Minimum | 2.8% | 4.1% |
| Maximum | 31.2% | 36.3% |
| Range | 28.3% | 32.2% |
| Mean | 9.3% | 13.8% |
| Median | 9.0% | 12.9% |
| Interquartile 25% (IQ1) | 7.6% | 9.9% |
| Interquartile 75% (IQ3) | 10.6% | 15.9% |
| Interquartile Range (IQR) | 3.0% | 6.0% |
| Standard Deviation (Sample) | 3.4% | 6.9% |
| Standard Deviation (Population) | 3.4% | 6.8% |
Similar Demographics by Male Poverty
Demographics Similar to Immigrants from Asia by Male Poverty
In terms of male poverty, the demographic groups most similar to Immigrants from Asia are Immigrants from Eastern Europe (10.2%, a difference of 0.070%), Immigrants from Canada (10.2%, a difference of 0.080%), Carpatho Rusyn (10.2%, a difference of 0.080%), Dutch (10.2%, a difference of 0.080%), and European (10.2%, a difference of 0.090%).
| Demographics | Rating | Rank | Male Poverty |
| Serbians | 97.5 /100 | #66 | Exceptional 10.2% |
| Immigrants | Netherlands | 97.3 /100 | #67 | Exceptional 10.2% |
| Immigrants | Sri Lanka | 97.2 /100 | #68 | Exceptional 10.2% |
| Immigrants | Australia | 97.1 /100 | #69 | Exceptional 10.2% |
| Paraguayans | 97.1 /100 | #70 | Exceptional 10.2% |
| Europeans | 97.1 /100 | #71 | Exceptional 10.2% |
| Immigrants | Canada | 97.1 /100 | #72 | Exceptional 10.2% |
| Immigrants | Asia | 97.0 /100 | #73 | Exceptional 10.2% |
| Immigrants | Eastern Europe | 96.9 /100 | #74 | Exceptional 10.2% |
| Carpatho Rusyns | 96.9 /100 | #75 | Exceptional 10.2% |
| Dutch | 96.9 /100 | #76 | Exceptional 10.2% |
| Immigrants | Belgium | 96.8 /100 | #77 | Exceptional 10.3% |
| Irish | 96.8 /100 | #78 | Exceptional 10.3% |
| Immigrants | North America | 96.5 /100 | #79 | Exceptional 10.3% |
| English | 96.4 /100 | #80 | Exceptional 10.3% |
Demographics Similar to French American Indians by Male Poverty
In terms of male poverty, the demographic groups most similar to French American Indians are Ecuadorian (12.7%, a difference of 0.030%), Ghanaian (12.7%, a difference of 0.030%), Immigrants from Saudi Arabia (12.7%, a difference of 0.050%), Immigrants from Laos (12.6%, a difference of 0.29%), and Immigrants from Middle Africa (12.7%, a difference of 0.31%).
| Demographics | Rating | Rank | Male Poverty |
| Marshallese | 0.8 /100 | #230 | Tragic 12.5% |
| Salvadorans | 0.6 /100 | #231 | Tragic 12.6% |
| Nicaraguans | 0.6 /100 | #232 | Tragic 12.6% |
| Fijians | 0.6 /100 | #233 | Tragic 12.6% |
| Immigrants | Armenia | 0.6 /100 | #234 | Tragic 12.6% |
| Immigrants | Laos | 0.5 /100 | #235 | Tragic 12.6% |
| Immigrants | Saudi Arabia | 0.4 /100 | #236 | Tragic 12.7% |
| French American Indians | 0.4 /100 | #237 | Tragic 12.7% |
| Ecuadorians | 0.4 /100 | #238 | Tragic 12.7% |
| Ghanaians | 0.4 /100 | #239 | Tragic 12.7% |
| Immigrants | Middle Africa | 0.4 /100 | #240 | Tragic 12.7% |
| Sudanese | 0.3 /100 | #241 | Tragic 12.8% |
| Nepalese | 0.3 /100 | #242 | Tragic 12.8% |
| Alaskan Athabascans | 0.3 /100 | #243 | Tragic 12.8% |
| Tsimshian | 0.3 /100 | #244 | Tragic 12.8% |