Immigrants from Asia vs Arab Single Mother Poverty

COMPARE

Immigrants from Asia
Race
Ancestry
AfghanAfricanAlaska NativeAlaskan AthabascanAlbanianAleutAlsatianAmericanApacheArapahoArgentineanArmenianAssyrian/Chaldean/SyriacAustralianAustrianBahamianBangladeshiBarbadianBasqueBelgianBelizeanBermudanBhutaneseBlackfeetBolivianBrazilianBritishBritish West IndianBulgarianBurmeseCajunCambodianCanadianCape VerdeanCarpatho RusynCelticCentral AmericanCentral American IndianCherokeeCheyenneChickasawChileanChineseChippewaChoctawColombianColvilleComancheCosta RicanCreeCreekCroatianCrowCubanCypriotCzechCzechoslovakianDanishDelawareDominicanDutchDutch West IndianEastern EuropeanEcuadorianEgyptianEnglishEstonianEthiopianEuropeanFijianFilipinoFinnishFrenchFrench American IndianFrench CanadianGermanGerman RussianGhanaianGreekGuamanian/ChamorroGuatemalanGuyaneseHaitianHmongHonduranHopiHoumaHungarianIcelanderIndian (Asian)IndonesianInupiatIranianIraqiIrishIroquoisIsraeliItalianJamaicanJapaneseJordanianKenyanKiowaKoreanLaotianLatvianLebaneseLiberianLithuanianLumbeeLuxembourgerMacedonianMalaysianMalteseMarshalleseMenomineeMexicanMexican American IndianMongolianMoroccanNative HawaiianNavajoNepaleseNew ZealanderNicaraguanNigerianNorthern EuropeanNorwegianOkinawanOsageOttawaPaiutePakistaniPalestinianPanamanianParaguayanPennsylvania GermanPeruvianPimaPolishPortuguesePotawatomiPuebloPuerto RicanPuget Sound SalishRomanianRussianSalvadoranSamoanScandinavianScotch-IrishScottishSeminoleSenegaleseSerbianShoshoneSierra LeoneanSiouxSlavicSlovakSloveneSomaliSouth AfricanSouth AmericanSouth American IndianSoviet UnionSpaniardSpanishSpanish AmericanSpanish American IndianSri LankanSubsaharan AfricanSudaneseSwedishSwissSyrianTaiwaneseThaiTlingit-HaidaTohono O'OdhamTonganTrinidadian and TobagonianTsimshianTurkishU.S. Virgin IslanderUgandanUkrainianUruguayanUteVenezuelanVietnameseWelshWest IndianYakamaYaquiYugoslavianYumanYup'ikZimbabwean
Immigration
NonimmigrantsImmigrantsAfghanistanAfricaAlbaniaArgentinaArmeniaAsiaAustraliaAustriaBahamasBangladeshBarbadosBelarusBelgiumBelizeBoliviaBosnia and HerzegovinaBrazilBulgariaBurma/MyanmarCabo VerdeCambodiaCameroonCanadaCaribbeanCentral AmericaChileChinaColombiaCongoCosta RicaCroatiaCubaCzechoslovakiaDenmarkDominicaDominican RepublicEastern AfricaEastern AsiaEastern EuropeEcuadorEgyptEl SalvadorEnglandEritreaEthiopiaEuropeFijiFranceGermanyGhanaGreeceGrenadaGuatemalaGuyanaHaitiHondurasHong KongHungaryIndiaIndonesiaIranIraqIrelandIsraelItalyJamaicaJapanJordanKazakhstanKenyaKoreaKuwaitLaosLatin AmericaLatviaLebanonLiberiaLithuaniaMalaysiaMexicoMicronesiaMiddle AfricaMoldovaMoroccoNepalNetherlandsNicaraguaNigeriaNorth AmericaNorth MacedoniaNorthern AfricaNorthern EuropeNorwayOceaniaPakistanPanamaPeruPhilippinesPolandPortugalRomaniaRussiaSaudi ArabiaScotlandSenegalSerbiaSierra LeoneSingaporeSomaliaSouth AfricaSouth AmericaSouth Central AsiaSouth Eastern AsiaSouthern EuropeSpainSri LankaSt. Vincent and the GrenadinesSudanSwedenSwitzerlandSyriaTaiwanThailandTrinidad and TobagoTurkeyUgandaUkraineUruguayUzbekistanVenezuelaVietnamWest IndiesWestern AfricaWestern AsiaWestern EuropeYemenZaireZimbabweAzores
Arab
Race
Ancestry
AfghanAfricanAlaska NativeAlaskan AthabascanAlbanianAleutAlsatianAmericanApacheArabArapahoArgentineanArmenianAssyrian/Chaldean/SyriacAustralianAustrianBahamianBangladeshiBarbadianBasqueBelgianBelizeanBermudanBhutaneseBlackfeetBolivianBrazilianBritishBritish West IndianBulgarianBurmeseCajunCambodianCanadianCape VerdeanCarpatho RusynCelticCentral AmericanCentral American IndianCherokeeCheyenneChickasawChileanChineseChippewaChoctawColombianColvilleComancheCosta RicanCreeCreekCroatianCrowCubanCypriotCzechCzechoslovakianDanishDelawareDominicanDutchDutch West IndianEastern EuropeanEcuadorianEgyptianEnglishEstonianEthiopianEuropeanFijianFilipinoFinnishFrenchFrench American IndianFrench CanadianGermanGerman RussianGhanaianGreekGuamanian/ChamorroGuatemalanGuyaneseHaitianHmongHonduranHopiHoumaHungarianIcelanderIndian (Asian)IndonesianInupiatIranianIraqiIrishIroquoisIsraeliItalianJamaicanJapaneseJordanianKenyanKiowaKoreanLaotianLatvianLebaneseLiberianLithuanianLumbeeLuxembourgerMacedonianMalaysianMalteseMarshalleseMenomineeMexicanMexican American IndianMongolianMoroccanNative HawaiianNavajoNepaleseNew ZealanderNicaraguanNigerianNorthern EuropeanNorwegianOkinawanOsageOttawaPaiutePakistaniPalestinianPanamanianParaguayanPennsylvania GermanPeruvianPimaPolishPortuguesePotawatomiPuebloPuerto RicanPuget Sound SalishRomanianRussianSalvadoranSamoanScandinavianScotch-IrishScottishSeminoleSenegaleseSerbianShoshoneSierra LeoneanSiouxSlavicSlovakSloveneSomaliSouth AfricanSouth AmericanSouth American IndianSoviet UnionSpaniardSpanishSpanish AmericanSpanish American IndianSri LankanSubsaharan AfricanSudaneseSwedishSwissSyrianTaiwaneseThaiTlingit-HaidaTohono O'OdhamTonganTrinidadian and TobagonianTsimshianTurkishU.S. Virgin IslanderUgandanUkrainianUruguayanUteVenezuelanVietnameseWelshWest IndianYakamaYaquiYugoslavianYumanYup'ikZimbabwean
Immigration
NonimmigrantsImmigrantsAfghanistanAfricaAlbaniaArgentinaArmeniaAustraliaAustriaBahamasBangladeshBarbadosBelarusBelgiumBelizeBoliviaBosnia and HerzegovinaBrazilBulgariaBurma/MyanmarCabo VerdeCambodiaCameroonCanadaCaribbeanCentral AmericaChileChinaColombiaCongoCosta RicaCroatiaCubaCzechoslovakiaDenmarkDominicaDominican RepublicEastern AfricaEastern AsiaEastern EuropeEcuadorEgyptEl SalvadorEnglandEritreaEthiopiaEuropeFijiFranceGermanyGhanaGreeceGrenadaGuatemalaGuyanaHaitiHondurasHong KongHungaryIndiaIndonesiaIranIraqIrelandIsraelItalyJamaicaJapanJordanKazakhstanKenyaKoreaKuwaitLaosLatin AmericaLatviaLebanonLiberiaLithuaniaMalaysiaMexicoMicronesiaMiddle AfricaMoldovaMoroccoNepalNetherlandsNicaraguaNigeriaNorth AmericaNorth MacedoniaNorthern AfricaNorthern EuropeNorwayOceaniaPakistanPanamaPeruPhilippinesPolandPortugalRomaniaRussiaSaudi ArabiaScotlandSenegalSerbiaSierra LeoneSingaporeSomaliaSouth AfricaSouth AmericaSouth Central AsiaSouth Eastern AsiaSouthern EuropeSpainSri LankaSt. Vincent and the GrenadinesSudanSwedenSwitzerlandSyriaTaiwanThailandTrinidad and TobagoTurkeyUgandaUkraineUruguayUzbekistanVenezuelaVietnamWest IndiesWestern AfricaWestern AsiaWestern EuropeYemenZaireZimbabweAzores
Single Mother Poverty
Income
Poverty
Unemployment
Labor Participation
Family Structure
Vehicle Availability
Education Level
Disability

Single Mother Poverty Comparison

Immigrants from Asia

Arabs

Exceptional
Good
26.3%
SINGLE MOTHER POVERTY
100.0/ 100
METRIC RATING
25th/ 347
METRIC RANK
29.0%
SINGLE MOTHER POVERTY
60.7/ 100
METRIC RATING
165th/ 347
METRIC RANK

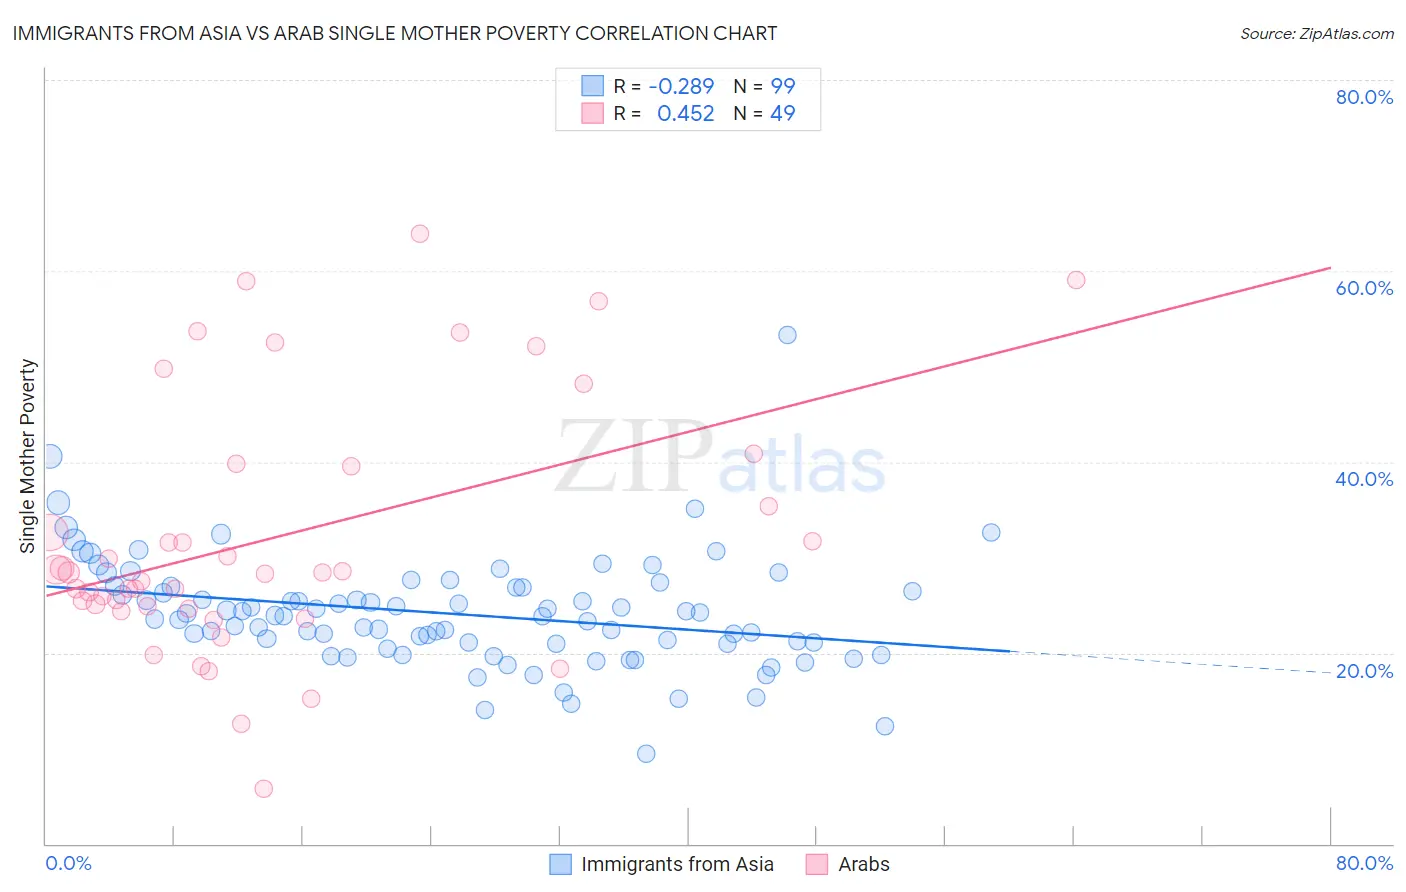
Immigrants from Asia vs Arab Single Mother Poverty Correlation Chart

The statistical analysis conducted on geographies consisting of 525,815,125 people shows a weak negative correlation between the proportion of Immigrants from Asia and poverty level among single mothers in the United States with a correlation coefficient (R) of -0.289 and weighted average of 26.3%. Similarly, the statistical analysis conducted on geographies consisting of 470,668,307 people shows a moderate positive correlation between the proportion of Arabs and poverty level among single mothers in the United States with a correlation coefficient (R) of 0.452 and weighted average of 29.0%, a difference of 10.3%.
Immigrants from Asia vs Arab Single Mother Poverty

Single Mother Poverty Correlation Summary

MeasurementImmigrants from AsiaArab
Minimum9.5%5.8%
Maximum53.3%63.9%
Range43.9%58.1%
Mean24.1%32.2%
Median23.9%28.4%
Interquartile 25% (IQ1)21.0%24.8%
Interquartile 75% (IQ3)26.9%39.7%
Interquartile Range (IQR)5.9%14.9%
Standard Deviation (Sample)5.9%13.3%
Standard Deviation (Population)5.9%13.2%

Similar Demographics by Single Mother Poverty

Demographics Similar to Immigrants from Asia by Single Mother Poverty

In terms of single mother poverty, the demographic groups most similar to Immigrants from Asia are Immigrants from Sri Lanka (26.3%, a difference of 0.13%), Immigrants from Moldova (26.2%, a difference of 0.19%), Burmese (26.2%, a difference of 0.22%), Immigrants from Japan (26.4%, a difference of 0.36%), and Korean (26.4%, a difference of 0.37%).
DemographicsRating | RankSingle Mother Poverty
Immigrants | Pakistan
100.0
/100
|
#18
Exceptional
26.0%
Immigrants | Eastern Asia
100.0
/100
|
#19
Exceptional
26.1%
Immigrants | China
100.0
/100
|
#20
Exceptional
26.1%
Immigrants | Bolivia
100.0
/100
|
#21
Exceptional
26.2%
Immigrants | Korea
100.0
/100
|
#22
Exceptional
26.2%
Burmese
100.0
/100
|
#23
Exceptional
26.2%
Immigrants | Moldova
100.0
/100
|
#24
Exceptional
26.2%
Immigrants | Asia
100.0
/100
|
#25
Exceptional
26.3%
Immigrants | Sri Lanka
100.0
/100
|
#26
Exceptional
26.3%
Immigrants | Japan
100.0
/100
|
#27
Exceptional
26.4%
Koreans
100.0
/100
|
#28
Exceptional
26.4%
Jordanians
100.0
/100
|
#29
Exceptional
26.4%
Turks
100.0
/100
|
#30
Exceptional
26.4%
Immigrants | Philippines
100.0
/100
|
#31
Exceptional
26.5%
Tongans
99.9
/100
|
#32
Exceptional
26.5%

Demographics Similar to Arabs by Single Mother Poverty

In terms of single mother poverty, the demographic groups most similar to Arabs are Inupiat (29.0%, a difference of 0.020%), Costa Rican (29.0%, a difference of 0.12%), European (29.1%, a difference of 0.16%), Immigrants from Uruguay (29.1%, a difference of 0.17%), and Immigrants from Nigeria (28.9%, a difference of 0.27%).
DemographicsRating | RankSingle Mother Poverty
Immigrants | Hungary
70.6
/100
|
#158
Good
28.9%
Czechs
68.4
/100
|
#159
Good
28.9%
Japanese
68.0
/100
|
#160
Good
28.9%
Immigrants | Cambodia
66.6
/100
|
#161
Good
28.9%
Scandinavians
66.2
/100
|
#162
Good
28.9%
Immigrants | Nigeria
65.9
/100
|
#163
Good
28.9%
Immigrants | Kenya
65.9
/100
|
#164
Good
28.9%
Arabs
60.7
/100
|
#165
Good
29.0%
Inupiat
60.4
/100
|
#166
Good
29.0%
Costa Ricans
58.4
/100
|
#167
Average
29.0%
Europeans
57.6
/100
|
#168
Average
29.1%
Immigrants | Uruguay
57.2
/100
|
#169
Average
29.1%
New Zealanders
55.1
/100
|
#170
Average
29.1%
Puget Sound Salish
55.1
/100
|
#171
Average
29.1%
Carpatho Rusyns
53.8
/100
|
#172
Average
29.1%