Immigrants from Armenia vs Thai Single Father Poverty
COMPARE
Immigrants from Armenia
Thai
Single Father Poverty
Single Father Poverty Comparison
Immigrants from Armenia
Thais
15.2%
SINGLE FATHER POVERTY
99.8/ 100
METRIC RATING
62nd/ 347
METRIC RANK
14.5%
SINGLE FATHER POVERTY
100.0/ 100
METRIC RATING
30th/ 347
METRIC RANK
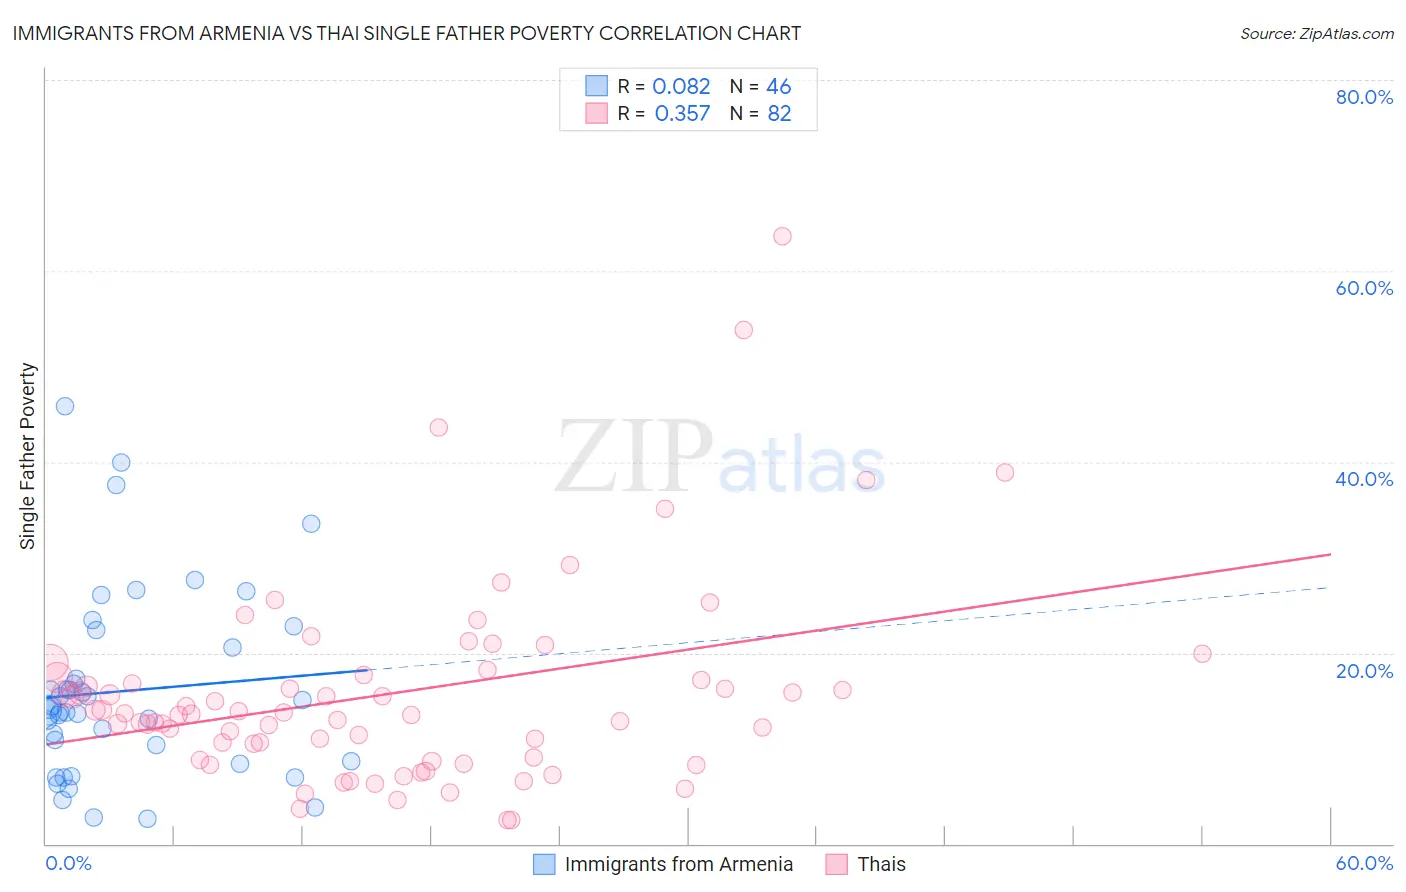
Immigrants from Armenia vs Thai Single Father Poverty Correlation Chart
The statistical analysis conducted on geographies consisting of 86,819,015 people shows a slight positive correlation between the proportion of Immigrants from Armenia and poverty level among single fathers in the United States with a correlation coefficient (R) of 0.082 and weighted average of 15.2%. Similarly, the statistical analysis conducted on geographies consisting of 363,511,447 people shows a mild positive correlation between the proportion of Thais and poverty level among single fathers in the United States with a correlation coefficient (R) of 0.357 and weighted average of 14.5%, a difference of 4.4%.
Single Father Poverty Correlation Summary
| Measurement | Immigrants from Armenia | Thai |
| Minimum | 2.6% | 2.5% |
| Maximum | 45.8% | 63.6% |
| Range | 43.2% | 61.2% |
| Mean | 16.0% | 15.7% |
| Median | 14.1% | 13.6% |
| Interquartile 25% (IQ1) | 8.7% | 9.0% |
| Interquartile 75% (IQ3) | 20.6% | 17.4% |
| Interquartile Range (IQR) | 11.9% | 8.4% |
| Standard Deviation (Sample) | 9.8% | 10.5% |
| Standard Deviation (Population) | 9.6% | 10.4% |
Similar Demographics by Single Father Poverty
Demographics Similar to Immigrants from Armenia by Single Father Poverty
In terms of single father poverty, the demographic groups most similar to Immigrants from Armenia are Immigrants from Bosnia and Herzegovina (15.2%, a difference of 0.010%), Puget Sound Salish (15.2%, a difference of 0.050%), Immigrants from Sweden (15.2%, a difference of 0.090%), Bangladeshi (15.2%, a difference of 0.17%), and Immigrants from Malaysia (15.2%, a difference of 0.26%).
| Demographics | Rating | Rank | Single Father Poverty |
| Immigrants | Bulgaria | 99.9 /100 | #55 | Exceptional 15.0% |
| Immigrants | Laos | 99.9 /100 | #56 | Exceptional 15.1% |
| Laotians | 99.9 /100 | #57 | Exceptional 15.1% |
| Hawaiians | 99.9 /100 | #58 | Exceptional 15.1% |
| Guamanians/Chamorros | 99.9 /100 | #59 | Exceptional 15.1% |
| Puget Sound Salish | 99.8 /100 | #60 | Exceptional 15.2% |
| Immigrants | Bosnia and Herzegovina | 99.8 /100 | #61 | Exceptional 15.2% |
| Immigrants | Armenia | 99.8 /100 | #62 | Exceptional 15.2% |
| Immigrants | Sweden | 99.8 /100 | #63 | Exceptional 15.2% |
| Bangladeshis | 99.8 /100 | #64 | Exceptional 15.2% |
| Immigrants | Malaysia | 99.8 /100 | #65 | Exceptional 15.2% |
| Immigrants | Moldova | 99.8 /100 | #66 | Exceptional 15.2% |
| Paraguayans | 99.7 /100 | #67 | Exceptional 15.2% |
| Immigrants | Cameroon | 99.7 /100 | #68 | Exceptional 15.2% |
| Japanese | 99.7 /100 | #69 | Exceptional 15.2% |
Demographics Similar to Thais by Single Father Poverty
In terms of single father poverty, the demographic groups most similar to Thais are Somali (14.5%, a difference of 0.040%), Icelander (14.5%, a difference of 0.080%), Immigrants from South Central Asia (14.5%, a difference of 0.15%), Asian (14.6%, a difference of 0.24%), and Nepalese (14.4%, a difference of 0.68%).
| Demographics | Rating | Rank | Single Father Poverty |
| Immigrants | Egypt | 100.0 /100 | #23 | Exceptional 14.4% |
| Immigrants | South Eastern Asia | 100.0 /100 | #24 | Exceptional 14.4% |
| Iranians | 100.0 /100 | #25 | Exceptional 14.4% |
| Spanish American Indians | 100.0 /100 | #26 | Exceptional 14.4% |
| Nepalese | 100.0 /100 | #27 | Exceptional 14.4% |
| Immigrants | South Central Asia | 100.0 /100 | #28 | Exceptional 14.5% |
| Somalis | 100.0 /100 | #29 | Exceptional 14.5% |
| Thais | 100.0 /100 | #30 | Exceptional 14.5% |
| Icelanders | 100.0 /100 | #31 | Exceptional 14.5% |
| Asians | 100.0 /100 | #32 | Exceptional 14.6% |
| Okinawans | 100.0 /100 | #33 | Exceptional 14.6% |
| Egyptians | 100.0 /100 | #34 | Exceptional 14.7% |
| Immigrants | Bolivia | 100.0 /100 | #35 | Exceptional 14.7% |
| Immigrants | Indonesia | 100.0 /100 | #36 | Exceptional 14.7% |
| Immigrants | Eastern Africa | 100.0 /100 | #37 | Exceptional 14.7% |