Immigrants from Argentina vs Immigrants from Italy Child Poverty Among Boys Under 16
COMPARE
Immigrants from Argentina
Immigrants from Italy
Child Poverty Among Boys Under 16
Child Poverty Among Boys Under 16 Comparison
Immigrants from Argentina
Immigrants from Italy
14.8%
CHILD POVERTY AMONG BOYS UNDER 16
97.1/ 100
METRIC RATING
89th/ 347
METRIC RANK
14.9%
CHILD POVERTY AMONG BOYS UNDER 16
96.7/ 100
METRIC RATING
94th/ 347
METRIC RANK
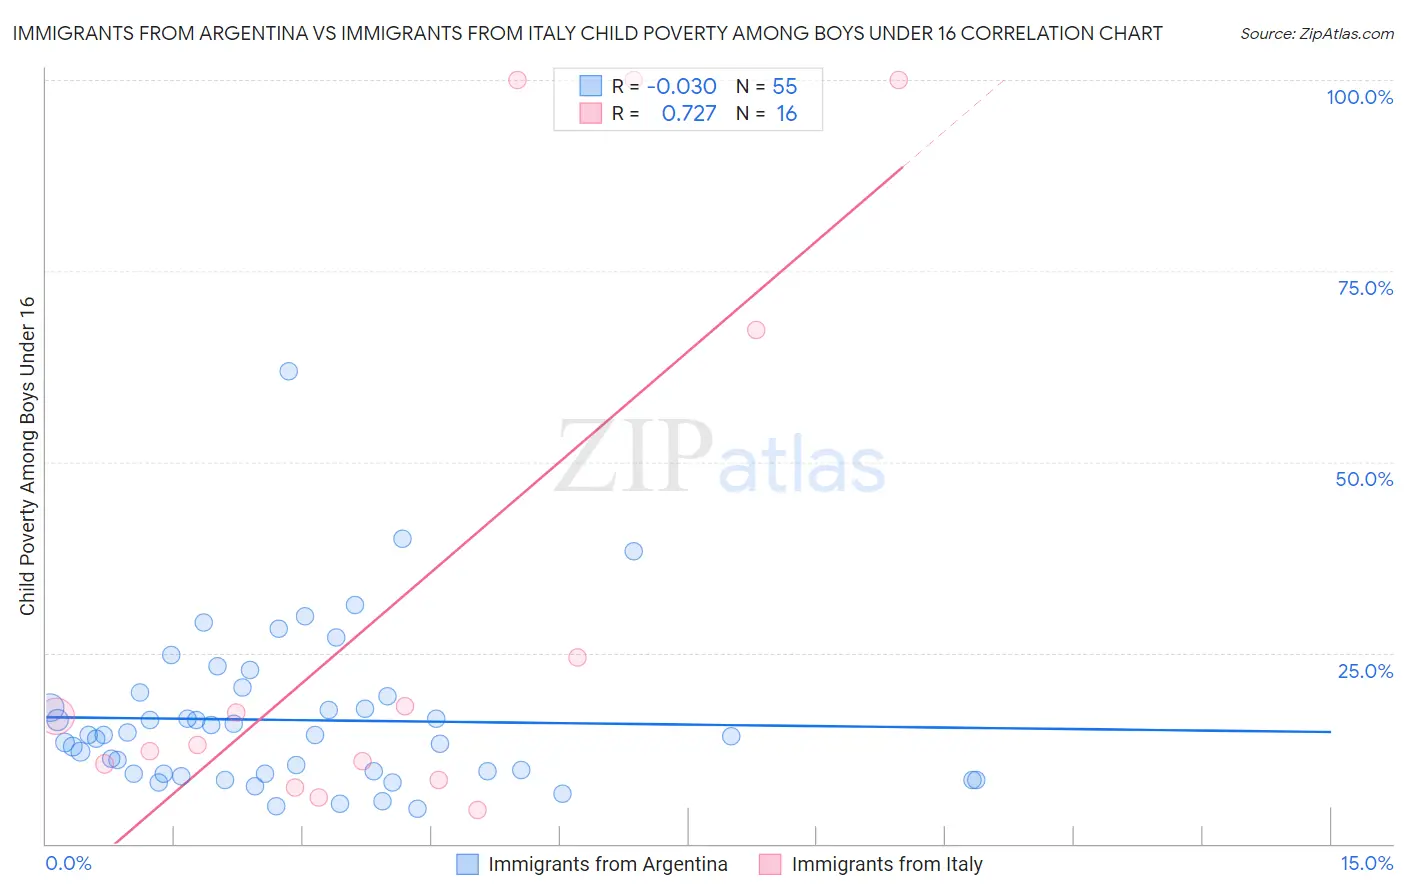
Immigrants from Argentina vs Immigrants from Italy Child Poverty Among Boys Under 16 Correlation Chart
The statistical analysis conducted on geographies consisting of 261,385,346 people shows no correlation between the proportion of Immigrants from Argentina and poverty level among boys under the age of 16 in the United States with a correlation coefficient (R) of -0.030 and weighted average of 14.8%. Similarly, the statistical analysis conducted on geographies consisting of 317,774,656 people shows a strong positive correlation between the proportion of Immigrants from Italy and poverty level among boys under the age of 16 in the United States with a correlation coefficient (R) of 0.727 and weighted average of 14.9%, a difference of 0.44%.
Child Poverty Among Boys Under 16 Correlation Summary
| Measurement | Immigrants from Argentina | Immigrants from Italy |
| Minimum | 4.7% | 4.4% |
| Maximum | 61.9% | 100.0% |
| Range | 57.2% | 95.6% |
| Mean | 16.2% | 32.2% |
| Median | 14.2% | 14.8% |
| Interquartile 25% (IQ1) | 9.2% | 9.4% |
| Interquartile 75% (IQ3) | 19.4% | 45.8% |
| Interquartile Range (IQR) | 10.2% | 36.4% |
| Standard Deviation (Sample) | 10.2% | 36.6% |
| Standard Deviation (Population) | 10.2% | 35.4% |
Demographics Similar to Immigrants from Argentina and Immigrants from Italy by Child Poverty Among Boys Under 16
In terms of child poverty among boys under 16, the demographic groups most similar to Immigrants from Argentina are Austrian (14.8%, a difference of 0.010%), Immigrants from North America (14.8%, a difference of 0.070%), Northern European (14.8%, a difference of 0.090%), German (14.8%, a difference of 0.14%), and Taiwanese (14.8%, a difference of 0.21%). Similarly, the demographic groups most similar to Immigrants from Italy are Sri Lankan (14.9%, a difference of 0.0%), Argentinean (14.9%, a difference of 0.050%), Finnish (14.9%, a difference of 0.10%), Paraguayan (14.9%, a difference of 0.13%), and Immigrants from North Macedonia (14.9%, a difference of 0.36%).
| Demographics | Rating | Rank | Child Poverty Among Boys Under 16 |
| Immigrants | Canada | 97.6 /100 | #81 | Exceptional 14.7% |
| Ukrainians | 97.6 /100 | #82 | Exceptional 14.7% |
| Immigrants | South Africa | 97.4 /100 | #83 | Exceptional 14.8% |
| Swiss | 97.3 /100 | #84 | Exceptional 14.8% |
| Taiwanese | 97.3 /100 | #85 | Exceptional 14.8% |
| Germans | 97.2 /100 | #86 | Exceptional 14.8% |
| Northern Europeans | 97.2 /100 | #87 | Exceptional 14.8% |
| Immigrants | North America | 97.1 /100 | #88 | Exceptional 14.8% |
| Immigrants | Argentina | 97.1 /100 | #89 | Exceptional 14.8% |
| Austrians | 97.1 /100 | #90 | Exceptional 14.8% |
| Paraguayans | 96.8 /100 | #91 | Exceptional 14.9% |
| Argentineans | 96.7 /100 | #92 | Exceptional 14.9% |
| Sri Lankans | 96.7 /100 | #93 | Exceptional 14.9% |
| Immigrants | Italy | 96.7 /100 | #94 | Exceptional 14.9% |
| Finns | 96.5 /100 | #95 | Exceptional 14.9% |
| Immigrants | North Macedonia | 96.3 /100 | #96 | Exceptional 14.9% |
| Immigrants | Egypt | 96.2 /100 | #97 | Exceptional 14.9% |
| British | 96.2 /100 | #98 | Exceptional 15.0% |
| Immigrants | France | 96.1 /100 | #99 | Exceptional 15.0% |
| Chileans | 95.8 /100 | #100 | Exceptional 15.0% |
| Immigrants | Belarus | 95.7 /100 | #101 | Exceptional 15.0% |