Immigrants from Argentina vs Central American Indian Family Poverty
COMPARE
Immigrants from Argentina
Central American Indian
Family Poverty
Family Poverty Comparison
Immigrants from Argentina
Central American Indians
8.4%
FAMILY POVERTY
88.2/ 100
METRIC RATING
132nd/ 347
METRIC RANK
13.3%
FAMILY POVERTY
0.0/ 100
METRIC RATING
328th/ 347
METRIC RANK
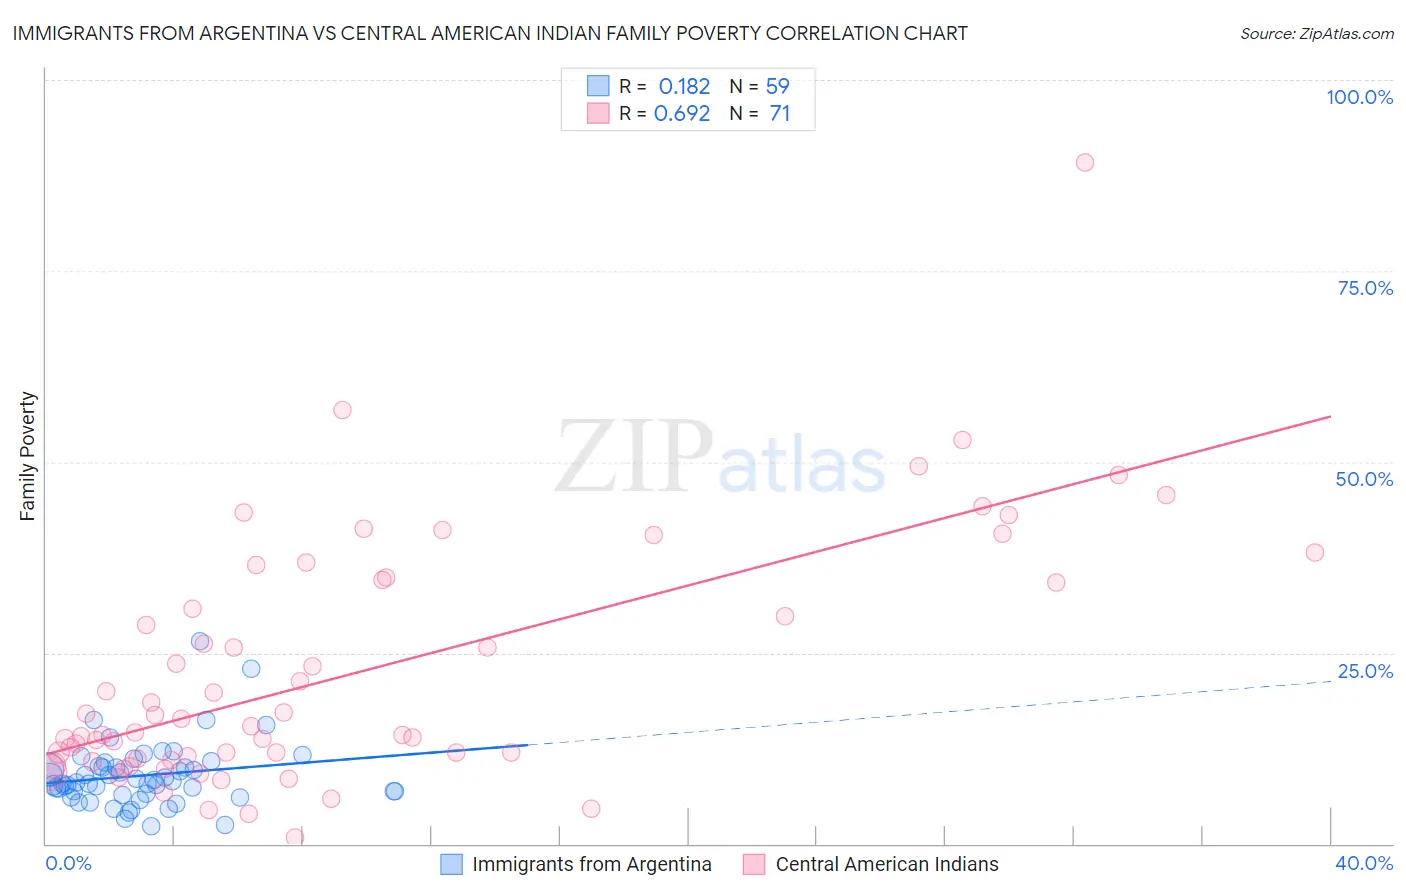
Immigrants from Argentina vs Central American Indian Family Poverty Correlation Chart
The statistical analysis conducted on geographies consisting of 264,069,938 people shows a poor positive correlation between the proportion of Immigrants from Argentina and poverty level among families in the United States with a correlation coefficient (R) of 0.182 and weighted average of 8.4%. Similarly, the statistical analysis conducted on geographies consisting of 325,737,058 people shows a significant positive correlation between the proportion of Central American Indians and poverty level among families in the United States with a correlation coefficient (R) of 0.692 and weighted average of 13.3%, a difference of 58.2%.
Family Poverty Correlation Summary
| Measurement | Immigrants from Argentina | Central American Indian |
| Minimum | 2.3% | 0.85% |
| Maximum | 26.5% | 89.1% |
| Range | 24.3% | 88.3% |
| Mean | 8.9% | 22.4% |
| Median | 8.1% | 15.5% |
| Interquartile 25% (IQ1) | 6.6% | 11.1% |
| Interquartile 75% (IQ3) | 10.1% | 34.5% |
| Interquartile Range (IQR) | 3.5% | 23.3% |
| Standard Deviation (Sample) | 4.3% | 16.1% |
| Standard Deviation (Population) | 4.2% | 16.0% |
Similar Demographics by Family Poverty
Demographics Similar to Immigrants from Argentina by Family Poverty
In terms of family poverty, the demographic groups most similar to Immigrants from Argentina are Puget Sound Salish (8.4%, a difference of 0.15%), Immigrants from Bosnia and Herzegovina (8.4%, a difference of 0.16%), Portuguese (8.4%, a difference of 0.34%), Argentinean (8.4%, a difference of 0.49%), and Sri Lankan (8.5%, a difference of 0.50%).
| Demographics | Rating | Rank | Family Poverty |
| Pakistanis | 90.8 /100 | #125 | Exceptional 8.3% |
| Icelanders | 90.3 /100 | #126 | Exceptional 8.3% |
| Immigrants | Hungary | 89.9 /100 | #127 | Excellent 8.4% |
| Argentineans | 89.6 /100 | #128 | Excellent 8.4% |
| Portuguese | 89.2 /100 | #129 | Excellent 8.4% |
| Immigrants | Bosnia and Herzegovina | 88.6 /100 | #130 | Excellent 8.4% |
| Puget Sound Salish | 88.6 /100 | #131 | Excellent 8.4% |
| Immigrants | Argentina | 88.2 /100 | #132 | Excellent 8.4% |
| Sri Lankans | 86.6 /100 | #133 | Excellent 8.5% |
| Chileans | 86.6 /100 | #134 | Excellent 8.5% |
| Immigrants | Malaysia | 86.5 /100 | #135 | Excellent 8.5% |
| Immigrants | Brazil | 86.3 /100 | #136 | Excellent 8.5% |
| Immigrants | Southern Europe | 86.0 /100 | #137 | Excellent 8.5% |
| Armenians | 84.6 /100 | #138 | Excellent 8.5% |
| Immigrants | Nepal | 84.2 /100 | #139 | Excellent 8.5% |
Demographics Similar to Central American Indians by Family Poverty
In terms of family poverty, the demographic groups most similar to Central American Indians are Black/African American (13.3%, a difference of 0.17%), Yakama (13.1%, a difference of 1.7%), Colville (13.0%, a difference of 2.4%), Paiute (13.0%, a difference of 2.4%), and Immigrants from Dominica (12.7%, a difference of 4.4%).
| Demographics | Rating | Rank | Family Poverty |
| Arapaho | 0.0 /100 | #321 | Tragic 12.7% |
| Immigrants | Honduras | 0.0 /100 | #322 | Tragic 12.7% |
| Menominee | 0.0 /100 | #323 | Tragic 12.7% |
| Immigrants | Dominica | 0.0 /100 | #324 | Tragic 12.7% |
| Paiute | 0.0 /100 | #325 | Tragic 13.0% |
| Colville | 0.0 /100 | #326 | Tragic 13.0% |
| Yakama | 0.0 /100 | #327 | Tragic 13.1% |
| Central American Indians | 0.0 /100 | #328 | Tragic 13.3% |
| Blacks/African Americans | 0.0 /100 | #329 | Tragic 13.3% |
| Natives/Alaskans | 0.0 /100 | #330 | Tragic 14.3% |
| Cheyenne | 0.0 /100 | #331 | Tragic 14.3% |
| Dominicans | 0.0 /100 | #332 | Tragic 14.3% |
| Immigrants | Dominican Republic | 0.0 /100 | #333 | Tragic 14.4% |
| Houma | 0.0 /100 | #334 | Tragic 14.6% |
| Apache | 0.0 /100 | #335 | Tragic 14.7% |