Immigrants from Albania vs Nonimmigrants Single Mother Poverty
COMPARE
Immigrants from Albania
Nonimmigrants
Single Mother Poverty
Single Mother Poverty Comparison
Immigrants from Albania
Nonimmigrants
27.8%
SINGLE MOTHER POVERTY
98.0/ 100
METRIC RATING
91st/ 347
METRIC RANK
32.2%
SINGLE MOTHER POVERTY
0.0/ 100
METRIC RATING
280th/ 347
METRIC RANK
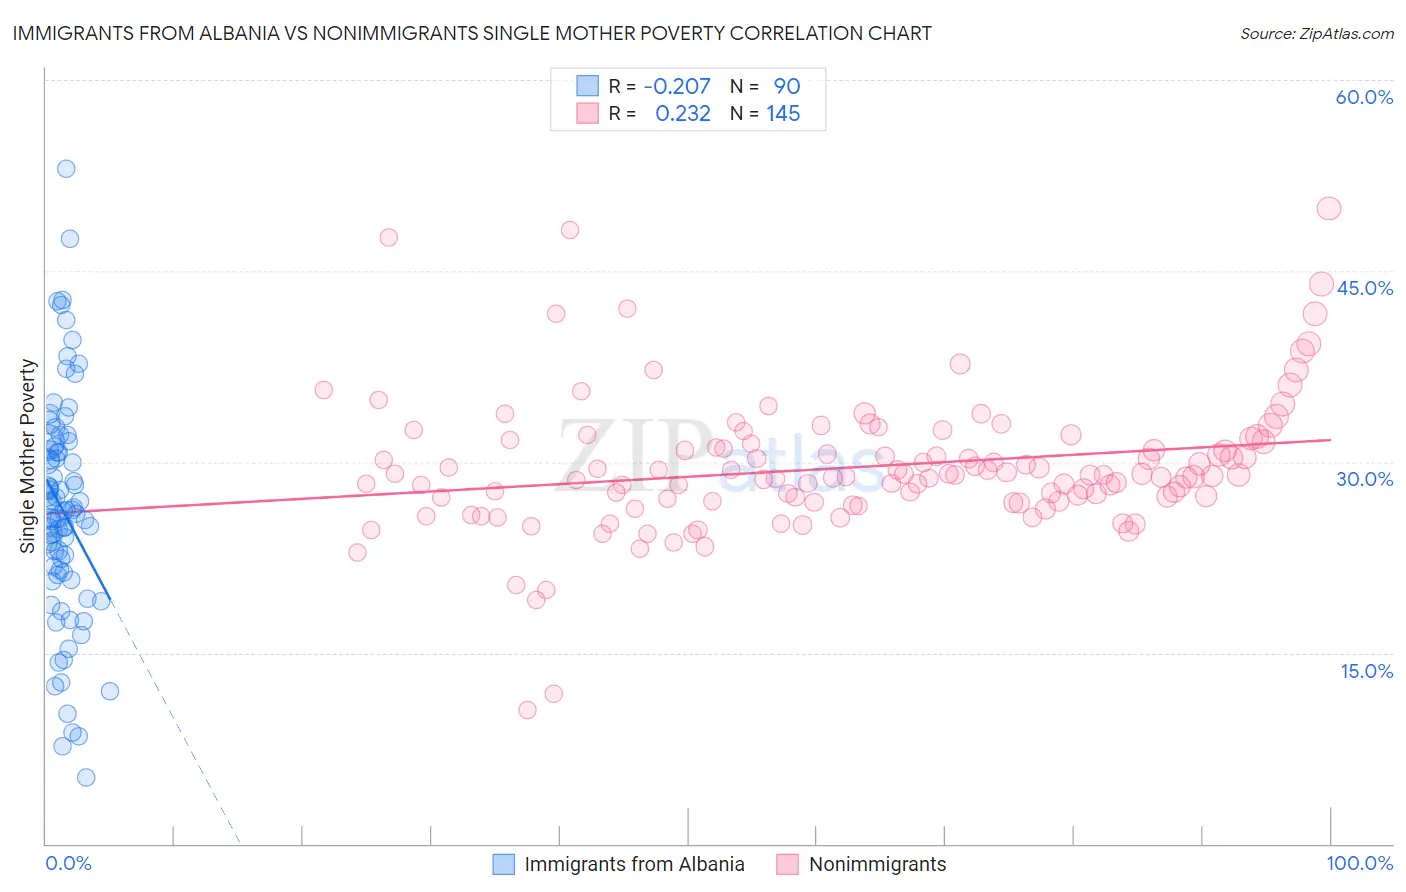
Immigrants from Albania vs Nonimmigrants Single Mother Poverty Correlation Chart
The statistical analysis conducted on geographies consisting of 117,790,749 people shows a weak negative correlation between the proportion of Immigrants from Albania and poverty level among single mothers in the United States with a correlation coefficient (R) of -0.207 and weighted average of 27.8%. Similarly, the statistical analysis conducted on geographies consisting of 553,388,851 people shows a weak positive correlation between the proportion of Nonimmigrants and poverty level among single mothers in the United States with a correlation coefficient (R) of 0.232 and weighted average of 32.2%, a difference of 15.7%.
Single Mother Poverty Correlation Summary
| Measurement | Immigrants from Albania | Nonimmigrants |
| Minimum | 5.2% | 10.6% |
| Maximum | 53.0% | 49.9% |
| Range | 47.8% | 39.4% |
| Mean | 26.1% | 29.6% |
| Median | 26.0% | 29.0% |
| Interquartile 25% (IQ1) | 21.3% | 27.0% |
| Interquartile 75% (IQ3) | 31.0% | 31.7% |
| Interquartile Range (IQR) | 9.7% | 4.7% |
| Standard Deviation (Sample) | 8.8% | 5.4% |
| Standard Deviation (Population) | 8.8% | 5.4% |
Similar Demographics by Single Mother Poverty
Demographics Similar to Immigrants from Albania by Single Mother Poverty
In terms of single mother poverty, the demographic groups most similar to Immigrants from Albania are Estonian (27.8%, a difference of 0.030%), Romanian (27.8%, a difference of 0.12%), Immigrants from France (27.8%, a difference of 0.14%), Albanian (27.9%, a difference of 0.22%), and Chilean (27.9%, a difference of 0.25%).
| Demographics | Rating | Rank | Single Mother Poverty |
| Immigrants | Latvia | 98.7 /100 | #84 | Exceptional 27.7% |
| Mongolians | 98.7 /100 | #85 | Exceptional 27.7% |
| Immigrants | Ukraine | 98.6 /100 | #86 | Exceptional 27.7% |
| Afghans | 98.5 /100 | #87 | Exceptional 27.7% |
| Ethiopians | 98.4 /100 | #88 | Exceptional 27.7% |
| Immigrants | Ethiopia | 98.4 /100 | #89 | Exceptional 27.7% |
| Immigrants | France | 98.2 /100 | #90 | Exceptional 27.8% |
| Immigrants | Albania | 98.0 /100 | #91 | Exceptional 27.8% |
| Estonians | 97.9 /100 | #92 | Exceptional 27.8% |
| Romanians | 97.8 /100 | #93 | Exceptional 27.8% |
| Albanians | 97.6 /100 | #94 | Exceptional 27.9% |
| Chileans | 97.5 /100 | #95 | Exceptional 27.9% |
| Immigrants | Iraq | 97.3 /100 | #96 | Exceptional 27.9% |
| Immigrants | Brazil | 97.2 /100 | #97 | Exceptional 27.9% |
| Immigrants | Nepal | 97.2 /100 | #98 | Exceptional 27.9% |
Demographics Similar to Nonimmigrants by Single Mother Poverty
In terms of single mother poverty, the demographic groups most similar to Nonimmigrants are Cree (32.2%, a difference of 0.030%), Immigrants from the Azores (32.2%, a difference of 0.14%), Marshallese (32.1%, a difference of 0.22%), Spanish American (32.3%, a difference of 0.39%), and Immigrants from Zaire (32.0%, a difference of 0.62%).
| Demographics | Rating | Rank | Single Mother Poverty |
| Fijians | 0.1 /100 | #273 | Tragic 31.6% |
| Bangladeshis | 0.1 /100 | #274 | Tragic 31.7% |
| Central Americans | 0.1 /100 | #275 | Tragic 31.8% |
| Delaware | 0.0 /100 | #276 | Tragic 31.8% |
| Mexican American Indians | 0.0 /100 | #277 | Tragic 31.9% |
| Immigrants | Zaire | 0.0 /100 | #278 | Tragic 32.0% |
| Marshallese | 0.0 /100 | #279 | Tragic 32.1% |
| Immigrants | Nonimmigrants | 0.0 /100 | #280 | Tragic 32.2% |
| Cree | 0.0 /100 | #281 | Tragic 32.2% |
| Immigrants | Azores | 0.0 /100 | #282 | Tragic 32.2% |
| Spanish Americans | 0.0 /100 | #283 | Tragic 32.3% |
| Indonesians | 0.0 /100 | #284 | Tragic 32.4% |
| Immigrants | Latin America | 0.0 /100 | #285 | Tragic 32.4% |
| Yup'ik | 0.0 /100 | #286 | Tragic 32.5% |
| Immigrants | Dominica | 0.0 /100 | #287 | Tragic 32.5% |