Immigrants from Albania vs Moroccan Single Male Poverty
COMPARE
Immigrants from Albania
Moroccan
Single Male Poverty
Single Male Poverty Comparison
Immigrants from Albania
Moroccans
12.4%
SINGLE MALE POVERTY
90.3/ 100
METRIC RATING
119th/ 347
METRIC RANK
12.9%
SINGLE MALE POVERTY
36.8/ 100
METRIC RATING
182nd/ 347
METRIC RANK
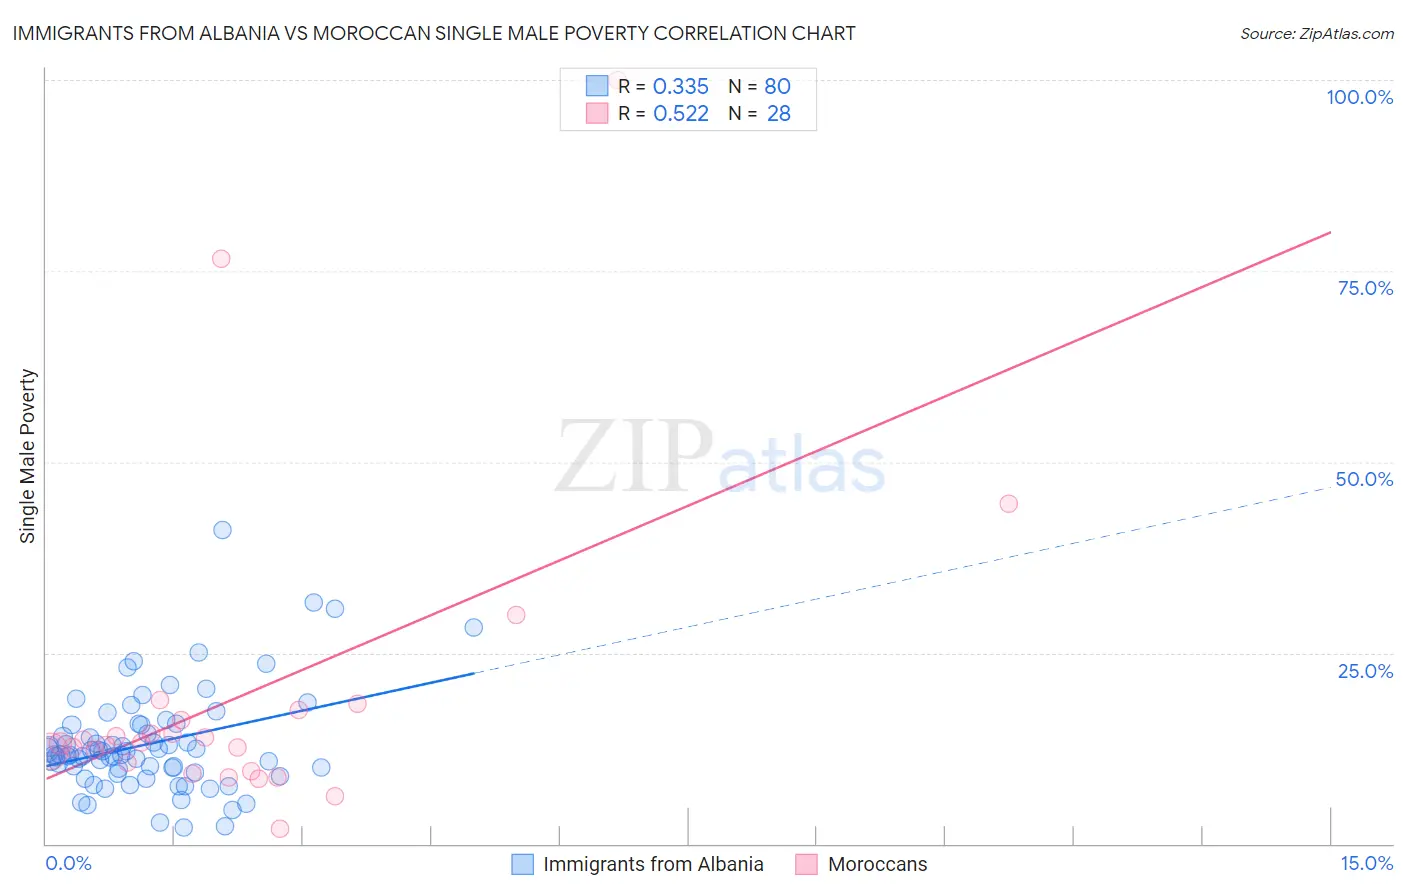
Immigrants from Albania vs Moroccan Single Male Poverty Correlation Chart
The statistical analysis conducted on geographies consisting of 110,814,842 people shows a mild positive correlation between the proportion of Immigrants from Albania and poverty level among single males in the United States with a correlation coefficient (R) of 0.335 and weighted average of 12.4%. Similarly, the statistical analysis conducted on geographies consisting of 188,123,639 people shows a substantial positive correlation between the proportion of Moroccans and poverty level among single males in the United States with a correlation coefficient (R) of 0.522 and weighted average of 12.9%, a difference of 3.8%.
Single Male Poverty Correlation Summary
| Measurement | Immigrants from Albania | Moroccan |
| Minimum | 2.1% | 1.9% |
| Maximum | 41.0% | 100.0% |
| Range | 38.9% | 98.1% |
| Mean | 13.1% | 19.4% |
| Median | 11.7% | 13.2% |
| Interquartile 25% (IQ1) | 9.6% | 10.0% |
| Interquartile 75% (IQ3) | 15.5% | 16.9% |
| Interquartile Range (IQR) | 5.9% | 6.9% |
| Standard Deviation (Sample) | 6.7% | 21.2% |
| Standard Deviation (Population) | 6.6% | 20.8% |
Similar Demographics by Single Male Poverty
Demographics Similar to Immigrants from Albania by Single Male Poverty
In terms of single male poverty, the demographic groups most similar to Immigrants from Albania are Albanian (12.4%, a difference of 0.030%), Immigrants from Oceania (12.4%, a difference of 0.13%), Immigrants from Syria (12.4%, a difference of 0.14%), Venezuelan (12.4%, a difference of 0.14%), and Immigrants from Southern Europe (12.4%, a difference of 0.20%).
| Demographics | Rating | Rank | Single Male Poverty |
| Kenyans | 93.3 /100 | #112 | Exceptional 12.4% |
| Pakistanis | 92.4 /100 | #113 | Exceptional 12.4% |
| Nicaraguans | 92.1 /100 | #114 | Exceptional 12.4% |
| Immigrants | Southern Europe | 91.5 /100 | #115 | Exceptional 12.4% |
| Immigrants | Syria | 91.2 /100 | #116 | Exceptional 12.4% |
| Immigrants | Oceania | 91.1 /100 | #117 | Exceptional 12.4% |
| Albanians | 90.6 /100 | #118 | Exceptional 12.4% |
| Immigrants | Albania | 90.3 /100 | #119 | Exceptional 12.4% |
| Venezuelans | 89.4 /100 | #120 | Excellent 12.4% |
| Icelanders | 88.2 /100 | #121 | Excellent 12.5% |
| Serbians | 87.9 /100 | #122 | Excellent 12.5% |
| Immigrants | Kenya | 87.6 /100 | #123 | Excellent 12.5% |
| Russians | 87.3 /100 | #124 | Excellent 12.5% |
| Immigrants | Jordan | 87.1 /100 | #125 | Excellent 12.5% |
| Romanians | 86.4 /100 | #126 | Excellent 12.5% |
Demographics Similar to Moroccans by Single Male Poverty
In terms of single male poverty, the demographic groups most similar to Moroccans are Panamanian (12.9%, a difference of 0.040%), Immigrants from North America (12.9%, a difference of 0.050%), Immigrants from West Indies (12.9%, a difference of 0.22%), Israeli (12.9%, a difference of 0.23%), and Immigrants from Trinidad and Tobago (12.9%, a difference of 0.25%).
| Demographics | Rating | Rank | Single Male Poverty |
| Croatians | 48.9 /100 | #175 | Average 12.8% |
| Syrians | 48.4 /100 | #176 | Average 12.8% |
| Immigrants | Canada | 44.8 /100 | #177 | Average 12.8% |
| Immigrants | Switzerland | 43.1 /100 | #178 | Average 12.8% |
| Israelis | 41.0 /100 | #179 | Average 12.9% |
| Immigrants | North America | 37.7 /100 | #180 | Fair 12.9% |
| Panamanians | 37.6 /100 | #181 | Fair 12.9% |
| Moroccans | 36.8 /100 | #182 | Fair 12.9% |
| Immigrants | West Indies | 33.0 /100 | #183 | Fair 12.9% |
| Immigrants | Trinidad and Tobago | 32.5 /100 | #184 | Fair 12.9% |
| Norwegians | 32.0 /100 | #185 | Fair 12.9% |
| Nigerians | 31.9 /100 | #186 | Fair 12.9% |
| Immigrants | Kuwait | 31.9 /100 | #187 | Fair 12.9% |
| Macedonians | 31.5 /100 | #188 | Fair 12.9% |
| Portuguese | 30.2 /100 | #189 | Fair 12.9% |