Immigrants from Afghanistan vs Belgian Child Poverty Under the Age of 16
COMPARE
Immigrants from Afghanistan
Belgian
Child Poverty Under the Age of 16
Child Poverty Under the Age of 16 Comparison
Immigrants from Afghanistan
Belgians
17.0%
CHILD POVERTY UNDER THE AGE OF 16
15.1/ 100
METRIC RATING
199th/ 347
METRIC RANK
14.9%
CHILD POVERTY UNDER THE AGE OF 16
93.3/ 100
METRIC RATING
113th/ 347
METRIC RANK
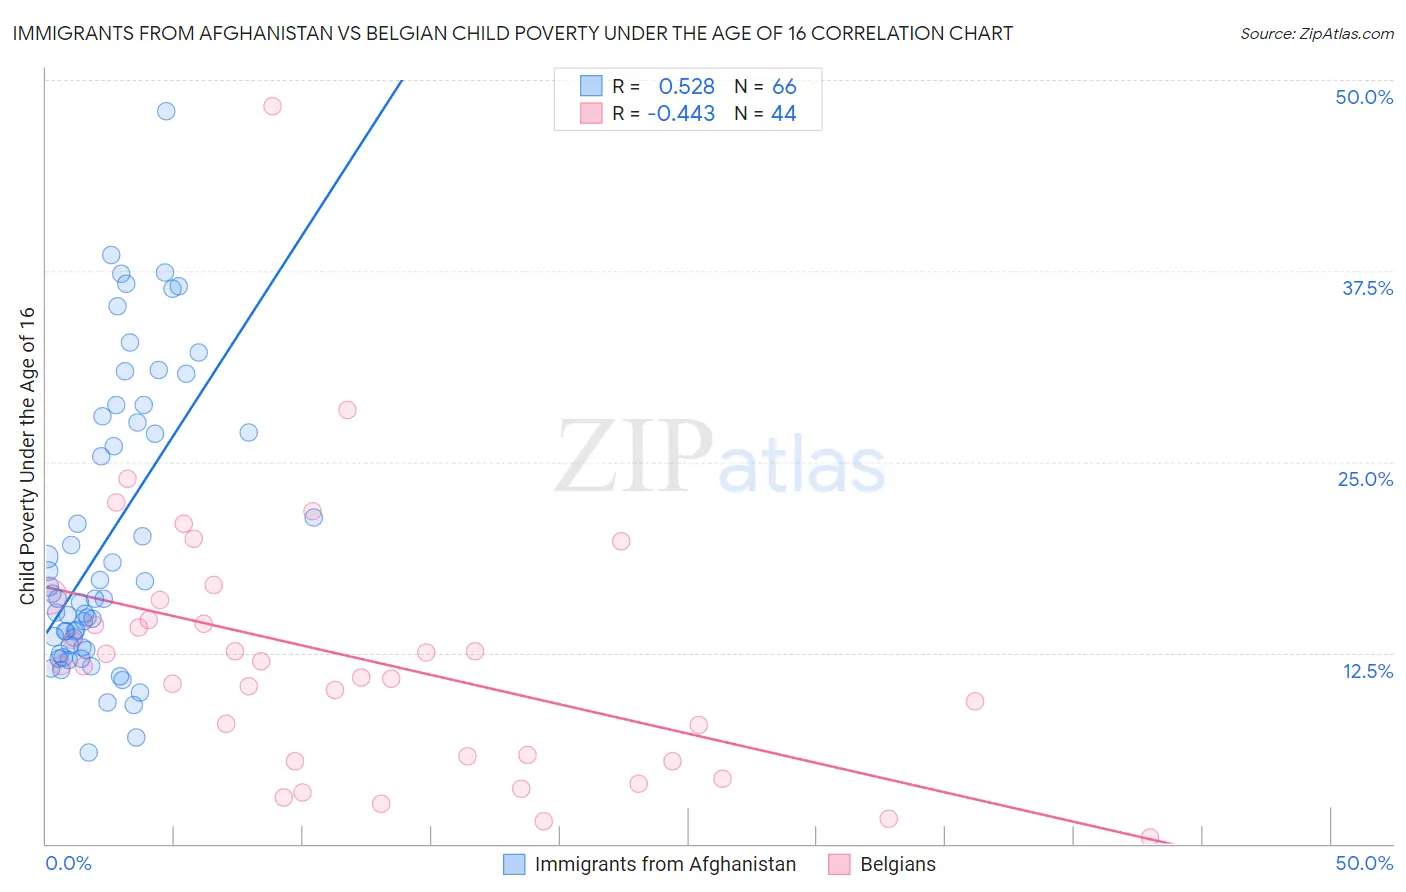
Immigrants from Afghanistan vs Belgian Child Poverty Under the Age of 16 Correlation Chart
The statistical analysis conducted on geographies consisting of 147,262,945 people shows a substantial positive correlation between the proportion of Immigrants from Afghanistan and poverty level among children under the age of 16 in the United States with a correlation coefficient (R) of 0.528 and weighted average of 17.0%. Similarly, the statistical analysis conducted on geographies consisting of 352,322,898 people shows a moderate negative correlation between the proportion of Belgians and poverty level among children under the age of 16 in the United States with a correlation coefficient (R) of -0.443 and weighted average of 14.9%, a difference of 14.2%.
Child Poverty Under the Age of 16 Correlation Summary
| Measurement | Immigrants from Afghanistan | Belgian |
| Minimum | 6.0% | 0.43% |
| Maximum | 48.0% | 48.3% |
| Range | 42.0% | 47.9% |
| Mean | 20.0% | 12.2% |
| Median | 16.0% | 11.6% |
| Interquartile 25% (IQ1) | 12.9% | 5.5% |
| Interquartile 75% (IQ3) | 27.6% | 15.3% |
| Interquartile Range (IQR) | 14.7% | 9.8% |
| Standard Deviation (Sample) | 9.6% | 8.7% |
| Standard Deviation (Population) | 9.5% | 8.6% |
Similar Demographics by Child Poverty Under the Age of 16
Demographics Similar to Immigrants from Afghanistan by Child Poverty Under the Age of 16
In terms of child poverty under the age of 16, the demographic groups most similar to Immigrants from Afghanistan are Immigrants from Cameroon (17.1%, a difference of 0.10%), Immigrants from Uzbekistan (17.1%, a difference of 0.11%), Ugandan (17.1%, a difference of 0.19%), Immigrants from Sierra Leone (17.1%, a difference of 0.21%), and Hmong (17.1%, a difference of 0.27%).
| Demographics | Rating | Rank | Child Poverty Under the Age of 16 |
| Spanish | 24.5 /100 | #192 | Fair 16.7% |
| Spaniards | 23.2 /100 | #193 | Fair 16.8% |
| Immigrants | Uruguay | 23.1 /100 | #194 | Fair 16.8% |
| Immigrants | Uganda | 22.5 /100 | #195 | Fair 16.8% |
| Immigrants | Lebanon | 22.0 /100 | #196 | Fair 16.8% |
| Immigrants | Kenya | 19.1 /100 | #197 | Poor 16.9% |
| Delaware | 17.1 /100 | #198 | Poor 17.0% |
| Immigrants | Afghanistan | 15.1 /100 | #199 | Poor 17.0% |
| Immigrants | Cameroon | 14.7 /100 | #200 | Poor 17.1% |
| Immigrants | Uzbekistan | 14.7 /100 | #201 | Poor 17.1% |
| Ugandans | 14.3 /100 | #202 | Poor 17.1% |
| Immigrants | Sierra Leone | 14.2 /100 | #203 | Poor 17.1% |
| Hmong | 14.0 /100 | #204 | Poor 17.1% |
| Aleuts | 13.9 /100 | #205 | Poor 17.1% |
| Alaska Natives | 11.8 /100 | #206 | Poor 17.2% |
Demographics Similar to Belgians by Child Poverty Under the Age of 16
In terms of child poverty under the age of 16, the demographic groups most similar to Belgians are Sri Lankan (14.9%, a difference of 0.030%), Irish (14.9%, a difference of 0.040%), Immigrants from Ukraine (14.9%, a difference of 0.090%), Immigrants from Denmark (14.9%, a difference of 0.10%), and English (14.9%, a difference of 0.11%).
| Demographics | Rating | Rank | Child Poverty Under the Age of 16 |
| Serbians | 94.5 /100 | #106 | Exceptional 14.8% |
| Chileans | 94.4 /100 | #107 | Exceptional 14.8% |
| Jordanians | 94.2 /100 | #108 | Exceptional 14.8% |
| Tlingit-Haida | 94.1 /100 | #109 | Exceptional 14.9% |
| English | 93.5 /100 | #110 | Exceptional 14.9% |
| Immigrants | Denmark | 93.5 /100 | #111 | Exceptional 14.9% |
| Irish | 93.4 /100 | #112 | Exceptional 14.9% |
| Belgians | 93.3 /100 | #113 | Exceptional 14.9% |
| Sri Lankans | 93.2 /100 | #114 | Exceptional 14.9% |
| Immigrants | Ukraine | 93.1 /100 | #115 | Exceptional 14.9% |
| Carpatho Rusyns | 93.1 /100 | #116 | Exceptional 14.9% |
| Immigrants | Norway | 92.8 /100 | #117 | Exceptional 15.0% |
| Immigrants | Malaysia | 92.6 /100 | #118 | Exceptional 15.0% |
| Scottish | 92.3 /100 | #119 | Exceptional 15.0% |
| South Africans | 92.1 /100 | #120 | Exceptional 15.0% |