Icelander vs Hmong Single Mother Poverty

COMPARE

Icelander
Race
Ancestry
AfghanAfricanAlaska NativeAlaskan AthabascanAlbanianAleutAlsatianAmericanApacheArabArapahoArgentineanArmenianAssyrian/Chaldean/SyriacAustralianAustrianBahamianBangladeshiBarbadianBasqueBelgianBelizeanBermudanBhutaneseBlackfeetBolivianBrazilianBritishBritish West IndianBulgarianBurmeseCajunCambodianCanadianCape VerdeanCarpatho RusynCelticCentral AmericanCentral American IndianCherokeeCheyenneChickasawChileanChineseChippewaChoctawColombianColvilleComancheCosta RicanCreeCreekCroatianCrowCubanCypriotCzechCzechoslovakianDanishDelawareDominicanDutchDutch West IndianEastern EuropeanEcuadorianEgyptianEnglishEstonianEthiopianEuropeanFijianFilipinoFinnishFrenchFrench American IndianFrench CanadianGermanGerman RussianGhanaianGreekGuamanian/ChamorroGuatemalanGuyaneseHaitianHonduranHopiHoumaHungarianIcelanderIndian (Asian)IndonesianInupiatIranianIraqiIrishIroquoisIsraeliItalianJamaicanJapaneseJordanianKenyanKiowaKoreanLaotianLatvianLebaneseLiberianLithuanianLumbeeLuxembourgerMacedonianMalaysianMalteseMarshalleseMenomineeMexicanMexican American IndianMongolianMoroccanNative HawaiianNavajoNepaleseNew ZealanderNicaraguanNigerianNorthern EuropeanNorwegianOkinawanOsageOttawaPaiutePakistaniPalestinianPanamanianParaguayanPennsylvania GermanPeruvianPimaPolishPortuguesePotawatomiPuebloPuerto RicanPuget Sound SalishRomanianRussianSalvadoranSamoanScandinavianScotch-IrishScottishSeminoleSenegaleseSerbianShoshoneSierra LeoneanSiouxSlavicSlovakSloveneSomaliSouth AfricanSouth AmericanSouth American IndianSoviet UnionSpaniardSpanishSpanish AmericanSpanish American IndianSri LankanSubsaharan AfricanSudaneseSwedishSwissSyrianTaiwaneseThaiTlingit-HaidaTohono O'OdhamTonganTrinidadian and TobagonianTsimshianTurkishU.S. Virgin IslanderUgandanUkrainianUruguayanUteVenezuelanVietnameseWelshWest IndianYakamaYaquiYugoslavianYumanYup'ikZimbabwean
Immigration
NonimmigrantsImmigrantsAfghanistanAfricaAlbaniaArgentinaArmeniaAsiaAustraliaAustriaBahamasBangladeshBarbadosBelarusBelgiumBelizeBoliviaBosnia and HerzegovinaBrazilBulgariaBurma/MyanmarCabo VerdeCambodiaCameroonCanadaCaribbeanCentral AmericaChileChinaColombiaCongoCosta RicaCroatiaCubaCzechoslovakiaDenmarkDominicaDominican RepublicEastern AfricaEastern AsiaEastern EuropeEcuadorEgyptEl SalvadorEnglandEritreaEthiopiaEuropeFijiFranceGermanyGhanaGreeceGrenadaGuatemalaGuyanaHaitiHondurasHong KongHungaryIndiaIndonesiaIranIraqIrelandIsraelItalyJamaicaJapanJordanKazakhstanKenyaKoreaKuwaitLaosLatin AmericaLatviaLebanonLiberiaLithuaniaMalaysiaMexicoMicronesiaMiddle AfricaMoldovaMoroccoNepalNetherlandsNicaraguaNigeriaNorth AmericaNorth MacedoniaNorthern AfricaNorthern EuropeNorwayOceaniaPakistanPanamaPeruPhilippinesPolandPortugalRomaniaRussiaSaudi ArabiaScotlandSenegalSerbiaSierra LeoneSingaporeSomaliaSouth AfricaSouth AmericaSouth Central AsiaSouth Eastern AsiaSouthern EuropeSpainSri LankaSt. Vincent and the GrenadinesSudanSwedenSwitzerlandSyriaTaiwanThailandTrinidad and TobagoTurkeyUgandaUkraineUruguayUzbekistanVenezuelaVietnamWest IndiesWestern AfricaWestern AsiaWestern EuropeYemenZaireZimbabweAzores
Hmong
Race
Ancestry
AfghanAfricanAlaska NativeAlaskan AthabascanAlbanianAleutAlsatianAmericanApacheArabArapahoArgentineanArmenianAssyrian/Chaldean/SyriacAustralianAustrianBahamianBangladeshiBarbadianBasqueBelgianBelizeanBermudanBhutaneseBlackfeetBolivianBrazilianBritishBritish West IndianBulgarianBurmeseCajunCambodianCanadianCape VerdeanCarpatho RusynCelticCentral AmericanCentral American IndianCherokeeCheyenneChickasawChileanChineseChippewaChoctawColombianColvilleComancheCosta RicanCreeCreekCroatianCrowCubanCypriotCzechCzechoslovakianDanishDelawareDominicanDutchDutch West IndianEastern EuropeanEcuadorianEgyptianEnglishEstonianEthiopianEuropeanFijianFilipinoFinnishFrenchFrench American IndianFrench CanadianGermanGerman RussianGhanaianGreekGuamanian/ChamorroGuatemalanGuyaneseHaitianHmongHonduranHopiHoumaHungarianIndian (Asian)IndonesianInupiatIranianIraqiIrishIroquoisIsraeliItalianJamaicanJapaneseJordanianKenyanKiowaKoreanLaotianLatvianLebaneseLiberianLithuanianLumbeeLuxembourgerMacedonianMalaysianMalteseMarshalleseMenomineeMexicanMexican American IndianMongolianMoroccanNative HawaiianNavajoNepaleseNew ZealanderNicaraguanNigerianNorthern EuropeanNorwegianOkinawanOsageOttawaPaiutePakistaniPalestinianPanamanianParaguayanPennsylvania GermanPeruvianPimaPolishPortuguesePotawatomiPuebloPuerto RicanPuget Sound SalishRomanianRussianSalvadoranSamoanScandinavianScotch-IrishScottishSeminoleSenegaleseSerbianShoshoneSierra LeoneanSiouxSlavicSlovakSloveneSomaliSouth AfricanSouth AmericanSouth American IndianSoviet UnionSpaniardSpanishSpanish AmericanSpanish American IndianSri LankanSubsaharan AfricanSudaneseSwedishSwissSyrianTaiwaneseThaiTlingit-HaidaTohono O'OdhamTonganTrinidadian and TobagonianTsimshianTurkishU.S. Virgin IslanderUgandanUkrainianUruguayanUteVenezuelanVietnameseWelshWest IndianYakamaYaquiYugoslavianYumanYup'ikZimbabwean
Immigration
NonimmigrantsImmigrantsAfghanistanAfricaAlbaniaArgentinaArmeniaAsiaAustraliaAustriaBahamasBangladeshBarbadosBelarusBelgiumBelizeBoliviaBosnia and HerzegovinaBrazilBulgariaBurma/MyanmarCabo VerdeCambodiaCameroonCanadaCaribbeanCentral AmericaChileChinaColombiaCongoCosta RicaCroatiaCubaCzechoslovakiaDenmarkDominicaDominican RepublicEastern AfricaEastern AsiaEastern EuropeEcuadorEgyptEl SalvadorEnglandEritreaEthiopiaEuropeFijiFranceGermanyGhanaGreeceGrenadaGuatemalaGuyanaHaitiHondurasHong KongHungaryIndiaIndonesiaIranIraqIrelandIsraelItalyJamaicaJapanJordanKazakhstanKenyaKoreaKuwaitLaosLatin AmericaLatviaLebanonLiberiaLithuaniaMalaysiaMexicoMicronesiaMiddle AfricaMoldovaMoroccoNepalNetherlandsNicaraguaNigeriaNorth AmericaNorth MacedoniaNorthern AfricaNorthern EuropeNorwayOceaniaPakistanPanamaPeruPhilippinesPolandPortugalRomaniaRussiaSaudi ArabiaScotlandSenegalSerbiaSierra LeoneSingaporeSomaliaSouth AfricaSouth AmericaSouth Central AsiaSouth Eastern AsiaSouthern EuropeSpainSri LankaSt. Vincent and the GrenadinesSudanSwedenSwitzerlandSyriaTaiwanThailandTrinidad and TobagoTurkeyUgandaUkraineUruguayUzbekistanVenezuelaVietnamWest IndiesWestern AfricaWestern AsiaWestern EuropeYemenZaireZimbabweAzores
Single Mother Poverty
Income
Poverty
Unemployment
Labor Participation
Family Structure
Vehicle Availability
Education Level
Disability

Single Mother Poverty Comparison

Icelanders

Hmong

Fair
Tragic
29.5%
SINGLE MOTHER POVERTY
26.1/ 100
METRIC RATING
194th/ 347
METRIC RANK
31.2%
SINGLE MOTHER POVERTY
0.3/ 100
METRIC RATING
262nd/ 347
METRIC RANK

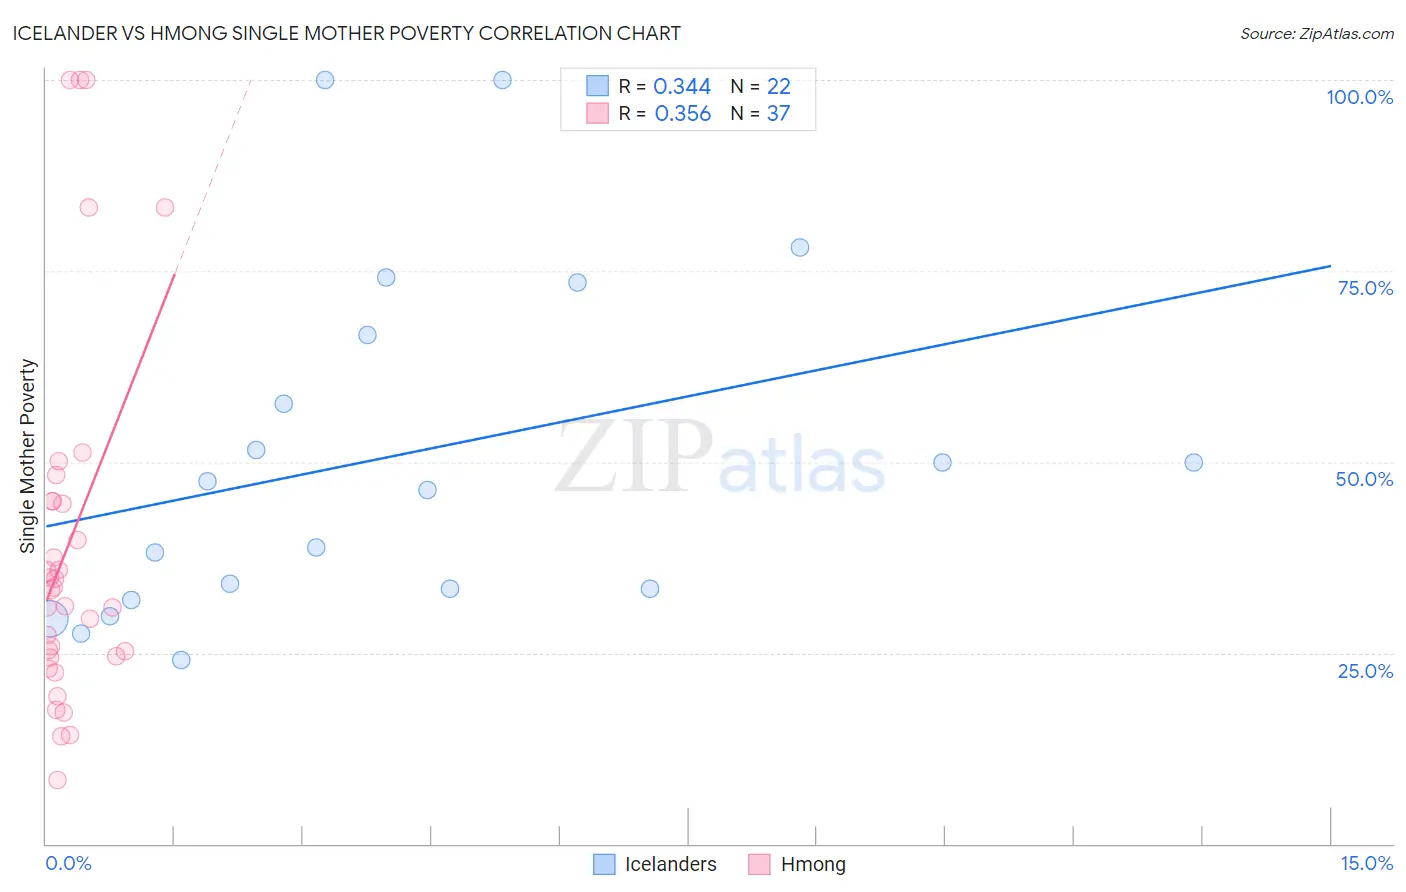
Icelander vs Hmong Single Mother Poverty Correlation Chart

The statistical analysis conducted on geographies consisting of 157,541,797 people shows a mild positive correlation between the proportion of Icelanders and poverty level among single mothers in the United States with a correlation coefficient (R) of 0.344 and weighted average of 29.5%. Similarly, the statistical analysis conducted on geographies consisting of 24,640,250 people shows a mild positive correlation between the proportion of Hmong and poverty level among single mothers in the United States with a correlation coefficient (R) of 0.356 and weighted average of 31.2%, a difference of 5.8%.
Icelander vs Hmong Single Mother Poverty

Single Mother Poverty Correlation Summary

MeasurementIcelanderHmong
Minimum24.1%8.4%
Maximum100.0%100.0%
Range75.9%91.6%
Mean50.7%39.1%
Median46.9%33.2%
Interquartile 25% (IQ1)33.3%24.5%
Interquartile 75% (IQ3)66.7%44.8%
Interquartile Range (IQR)33.3%20.3%
Standard Deviation (Sample)22.6%24.2%
Standard Deviation (Population)22.0%23.9%

Similar Demographics by Single Mother Poverty

Demographics Similar to Icelanders by Single Mother Poverty

In terms of single mother poverty, the demographic groups most similar to Icelanders are Slavic (29.6%, a difference of 0.10%), Basque (29.5%, a difference of 0.13%), Moroccan (29.5%, a difference of 0.15%), Spanish American Indian (29.6%, a difference of 0.17%), and Immigrants from Trinidad and Tobago (29.5%, a difference of 0.19%).
DemographicsRating | RankSingle Mother Poverty
Lebanese
32.5
/100
|
#187
Fair
29.4%
Guamanians/Chamorros
31.8
/100
|
#188
Fair
29.4%
Immigrants | Africa
31.6
/100
|
#189
Fair
29.4%
Immigrants | Germany
30.4
/100
|
#190
Fair
29.5%
Immigrants | Trinidad and Tobago
29.2
/100
|
#191
Fair
29.5%
Moroccans
28.6
/100
|
#192
Fair
29.5%
Basques
28.3
/100
|
#193
Fair
29.5%
Icelanders
26.1
/100
|
#194
Fair
29.5%
Slavs
24.5
/100
|
#195
Fair
29.6%
Spanish American Indians
23.4
/100
|
#196
Fair
29.6%
Immigrants | Jamaica
22.0
/100
|
#197
Fair
29.6%
Trinidadians and Tobagonians
21.7
/100
|
#198
Fair
29.6%
Cubans
20.8
/100
|
#199
Fair
29.6%
Panamanians
20.0
/100
|
#200
Fair
29.6%
Belgians
18.8
/100
|
#201
Poor
29.7%

Demographics Similar to Hmong by Single Mother Poverty

In terms of single mother poverty, the demographic groups most similar to Hmong are Immigrants from El Salvador (31.2%, a difference of 0.14%), White/Caucasian (31.2%, a difference of 0.21%), Bahamian (31.3%, a difference of 0.27%), Immigrants from Ecuador (31.3%, a difference of 0.28%), and German Russian (31.3%, a difference of 0.31%).
DemographicsRating | RankSingle Mother Poverty
Belizeans
0.5
/100
|
#255
Tragic
31.0%
Immigrants | West Indies
0.4
/100
|
#256
Tragic
31.1%
Immigrants | Bahamas
0.4
/100
|
#257
Tragic
31.1%
Immigrants | Caribbean
0.4
/100
|
#258
Tragic
31.1%
Immigrants | Bangladesh
0.4
/100
|
#259
Tragic
31.1%
Whites/Caucasians
0.3
/100
|
#260
Tragic
31.2%
Immigrants | El Salvador
0.3
/100
|
#261
Tragic
31.2%
Hmong
0.3
/100
|
#262
Tragic
31.2%
Bahamians
0.2
/100
|
#263
Tragic
31.3%
Immigrants | Ecuador
0.2
/100
|
#264
Tragic
31.3%
German Russians
0.2
/100
|
#265
Tragic
31.3%
Sub-Saharan Africans
0.2
/100
|
#266
Tragic
31.4%
Immigrants | Belize
0.2
/100
|
#267
Tragic
31.4%
Immigrants | Senegal
0.1
/100
|
#268
Tragic
31.5%
Scotch-Irish
0.1
/100
|
#269
Tragic
31.5%