Hungarian vs Turkish Poverty
COMPARE
Hungarian
Turkish
Poverty
Poverty Comparison
Hungarians
Turks
12.2%
POVERTY
63.6/ 100
METRIC RATING
155th/ 347
METRIC RANK
11.0%
POVERTY
98.9/ 100
METRIC RATING
45th/ 347
METRIC RANK
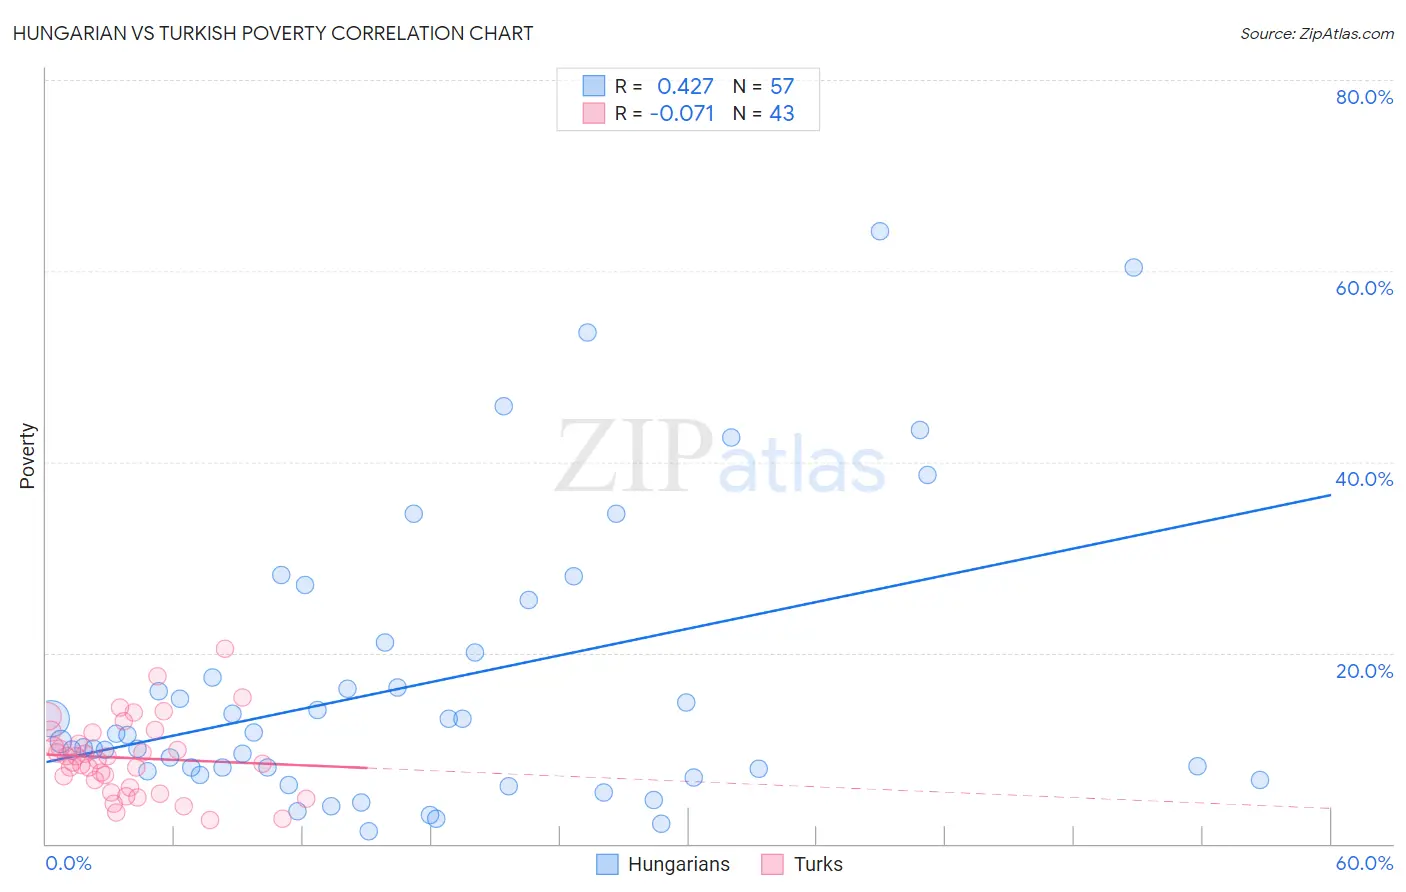
Hungarian vs Turkish Poverty Correlation Chart
The statistical analysis conducted on geographies consisting of 485,863,259 people shows a moderate positive correlation between the proportion of Hungarians and poverty level in the United States with a correlation coefficient (R) of 0.427 and weighted average of 12.2%. Similarly, the statistical analysis conducted on geographies consisting of 271,706,785 people shows a slight negative correlation between the proportion of Turks and poverty level in the United States with a correlation coefficient (R) of -0.071 and weighted average of 11.0%, a difference of 10.8%.
Poverty Correlation Summary
| Measurement | Hungarian | Turkish |
| Minimum | 1.3% | 2.5% |
| Maximum | 64.2% | 20.5% |
| Range | 62.9% | 18.0% |
| Mean | 16.8% | 9.0% |
| Median | 11.3% | 8.7% |
| Interquartile 25% (IQ1) | 7.4% | 6.0% |
| Interquartile 75% (IQ3) | 20.5% | 11.6% |
| Interquartile Range (IQR) | 13.1% | 5.7% |
| Standard Deviation (Sample) | 14.9% | 3.9% |
| Standard Deviation (Population) | 14.8% | 3.9% |
Similar Demographics by Poverty
Demographics Similar to Hungarians by Poverty
In terms of poverty, the demographic groups most similar to Hungarians are Guamanian/Chamorro (12.1%, a difference of 0.020%), Immigrants from Northern Africa (12.1%, a difference of 0.030%), Scotch-Irish (12.2%, a difference of 0.11%), Costa Rican (12.2%, a difference of 0.15%), and Taiwanese (12.2%, a difference of 0.19%).
| Demographics | Rating | Rank | Poverty |
| Immigrants | Germany | 72.7 /100 | #148 | Good 12.0% |
| Immigrants | Malaysia | 72.7 /100 | #149 | Good 12.0% |
| Immigrants | Kazakhstan | 72.3 /100 | #150 | Good 12.0% |
| Samoans | 71.9 /100 | #151 | Good 12.0% |
| Armenians | 67.6 /100 | #152 | Good 12.1% |
| Immigrants | Northern Africa | 63.9 /100 | #153 | Good 12.1% |
| Guamanians/Chamorros | 63.9 /100 | #154 | Good 12.1% |
| Hungarians | 63.6 /100 | #155 | Good 12.2% |
| Scotch-Irish | 62.6 /100 | #156 | Good 12.2% |
| Costa Ricans | 62.2 /100 | #157 | Good 12.2% |
| Taiwanese | 61.8 /100 | #158 | Good 12.2% |
| Pennsylvania Germans | 60.8 /100 | #159 | Good 12.2% |
| Immigrants | Nepal | 60.4 /100 | #160 | Good 12.2% |
| Immigrants | Fiji | 59.1 /100 | #161 | Average 12.2% |
| Ethiopians | 59.1 /100 | #162 | Average 12.2% |
Demographics Similar to Turks by Poverty
In terms of poverty, the demographic groups most similar to Turks are Immigrants from Czechoslovakia (11.0%, a difference of 0.080%), Immigrants from Romania (11.0%, a difference of 0.10%), Slovene (11.0%, a difference of 0.14%), Immigrants from Japan (11.0%, a difference of 0.15%), and Asian (11.0%, a difference of 0.18%).
| Demographics | Rating | Rank | Poverty |
| Czechs | 99.3 /100 | #38 | Exceptional 10.8% |
| Immigrants | Pakistan | 99.3 /100 | #39 | Exceptional 10.8% |
| Russians | 99.3 /100 | #40 | Exceptional 10.9% |
| Immigrants | Iran | 99.2 /100 | #41 | Exceptional 10.9% |
| Koreans | 99.2 /100 | #42 | Exceptional 10.9% |
| Immigrants | Singapore | 99.2 /100 | #43 | Exceptional 10.9% |
| Immigrants | Moldova | 99.1 /100 | #44 | Exceptional 10.9% |
| Turks | 98.9 /100 | #45 | Exceptional 11.0% |
| Immigrants | Czechoslovakia | 98.9 /100 | #46 | Exceptional 11.0% |
| Immigrants | Romania | 98.9 /100 | #47 | Exceptional 11.0% |
| Slovenes | 98.9 /100 | #48 | Exceptional 11.0% |
| Immigrants | Japan | 98.9 /100 | #49 | Exceptional 11.0% |
| Asians | 98.9 /100 | #50 | Exceptional 11.0% |
| Immigrants | Croatia | 98.7 /100 | #51 | Exceptional 11.0% |
| Immigrants | Philippines | 98.7 /100 | #52 | Exceptional 11.0% |