Hungarian vs Samoan Male Poverty

COMPARE

Hungarian
Race
Ancestry
AfghanAfricanAlaska NativeAlaskan AthabascanAlbanianAleutAlsatianAmericanApacheArabArapahoArgentineanArmenianAssyrian/Chaldean/SyriacAustralianAustrianBahamianBangladeshiBarbadianBasqueBelgianBelizeanBermudanBhutaneseBlackfeetBolivianBrazilianBritishBritish West IndianBulgarianBurmeseCajunCambodianCanadianCape VerdeanCarpatho RusynCelticCentral AmericanCentral American IndianCherokeeCheyenneChickasawChileanChineseChippewaChoctawColombianColvilleComancheCosta RicanCreeCreekCroatianCrowCubanCypriotCzechCzechoslovakianDanishDelawareDominicanDutchDutch West IndianEastern EuropeanEcuadorianEgyptianEnglishEstonianEthiopianEuropeanFijianFilipinoFinnishFrenchFrench American IndianFrench CanadianGermanGerman RussianGhanaianGreekGuamanian/ChamorroGuatemalanGuyaneseHaitianHmongHonduranHopiHoumaHungarianIcelanderIndian (Asian)IndonesianInupiatIranianIraqiIrishIroquoisIsraeliItalianJamaicanJapaneseJordanianKenyanKiowaKoreanLaotianLatvianLebaneseLiberianLithuanianLumbeeLuxembourgerMacedonianMalaysianMalteseMarshalleseMenomineeMexicanMexican American IndianMongolianMoroccanNative HawaiianNavajoNepaleseNew ZealanderNicaraguanNigerianNorthern EuropeanNorwegianOkinawanOsageOttawaPaiutePakistaniPalestinianPanamanianParaguayanPennsylvania GermanPeruvianPimaPolishPortuguesePotawatomiPuebloPuerto RicanPuget Sound SalishRomanianRussianSalvadoranScandinavianScotch-IrishScottishSeminoleSenegaleseSerbianShoshoneSierra LeoneanSiouxSlavicSlovakSloveneSomaliSouth AfricanSouth AmericanSouth American IndianSoviet UnionSpaniardSpanishSpanish AmericanSpanish American IndianSri LankanSubsaharan AfricanSudaneseSwedishSwissSyrianTaiwaneseThaiTlingit-HaidaTohono O'OdhamTonganTrinidadian and TobagonianTsimshianTurkishU.S. Virgin IslanderUgandanUkrainianUruguayanUteVenezuelanVietnameseWelshWest IndianYakamaYaquiYugoslavianYumanYup'ikZimbabwean
Immigration
NonimmigrantsImmigrantsAfghanistanAfricaAlbaniaArgentinaArmeniaAsiaAustraliaAustriaBahamasBangladeshBarbadosBelarusBelgiumBelizeBoliviaBosnia and HerzegovinaBrazilBulgariaBurma/MyanmarCabo VerdeCambodiaCameroonCanadaCaribbeanCentral AmericaChileChinaColombiaCongoCosta RicaCroatiaCubaCzechoslovakiaDenmarkDominicaDominican RepublicEastern AfricaEastern AsiaEastern EuropeEcuadorEgyptEl SalvadorEnglandEritreaEthiopiaEuropeFijiFranceGermanyGhanaGreeceGrenadaGuatemalaGuyanaHaitiHondurasHong KongHungaryIndiaIndonesiaIranIraqIrelandIsraelItalyJamaicaJapanJordanKazakhstanKenyaKoreaKuwaitLaosLatin AmericaLatviaLebanonLiberiaLithuaniaMalaysiaMexicoMicronesiaMiddle AfricaMoldovaMoroccoNepalNetherlandsNicaraguaNigeriaNorth AmericaNorth MacedoniaNorthern AfricaNorthern EuropeNorwayOceaniaPakistanPanamaPeruPhilippinesPolandPortugalRomaniaRussiaSaudi ArabiaScotlandSenegalSerbiaSierra LeoneSingaporeSomaliaSouth AfricaSouth AmericaSouth Central AsiaSouth Eastern AsiaSouthern EuropeSpainSri LankaSt. Vincent and the GrenadinesSudanSwedenSwitzerlandSyriaTaiwanThailandTrinidad and TobagoTurkeyUgandaUkraineUruguayUzbekistanVenezuelaVietnamWest IndiesWestern AfricaWestern AsiaWestern EuropeYemenZaireZimbabweAzores
Samoan
Race
Ancestry
AfghanAfricanAlaska NativeAlaskan AthabascanAlbanianAleutAlsatianAmericanApacheArabArapahoArgentineanArmenianAssyrian/Chaldean/SyriacAustralianAustrianBahamianBangladeshiBarbadianBasqueBelgianBelizeanBermudanBhutaneseBlackfeetBolivianBrazilianBritishBritish West IndianBulgarianBurmeseCajunCambodianCanadianCape VerdeanCarpatho RusynCelticCentral AmericanCentral American IndianCherokeeCheyenneChickasawChileanChineseChippewaChoctawColombianColvilleComancheCosta RicanCreeCreekCroatianCrowCubanCypriotCzechCzechoslovakianDanishDelawareDominicanDutchDutch West IndianEastern EuropeanEcuadorianEgyptianEnglishEstonianEthiopianEuropeanFijianFilipinoFinnishFrenchFrench American IndianFrench CanadianGermanGerman RussianGhanaianGreekGuamanian/ChamorroGuatemalanGuyaneseHaitianHmongHonduranHopiHoumaIcelanderIndian (Asian)IndonesianInupiatIranianIraqiIrishIroquoisIsraeliItalianJamaicanJapaneseJordanianKenyanKiowaKoreanLaotianLatvianLebaneseLiberianLithuanianLumbeeLuxembourgerMacedonianMalaysianMalteseMarshalleseMenomineeMexicanMexican American IndianMongolianMoroccanNative HawaiianNavajoNepaleseNew ZealanderNicaraguanNigerianNorthern EuropeanNorwegianOkinawanOsageOttawaPaiutePakistaniPalestinianPanamanianParaguayanPennsylvania GermanPeruvianPimaPolishPortuguesePotawatomiPuebloPuerto RicanPuget Sound SalishRomanianRussianSalvadoranSamoanScandinavianScotch-IrishScottishSeminoleSenegaleseSerbianShoshoneSierra LeoneanSiouxSlavicSlovakSloveneSomaliSouth AfricanSouth AmericanSouth American IndianSoviet UnionSpaniardSpanishSpanish AmericanSpanish American IndianSri LankanSubsaharan AfricanSudaneseSwedishSwissSyrianTaiwaneseThaiTlingit-HaidaTohono O'OdhamTonganTrinidadian and TobagonianTsimshianTurkishU.S. Virgin IslanderUgandanUkrainianUruguayanUteVenezuelanVietnameseWelshWest IndianYakamaYaquiYugoslavianYumanYup'ikZimbabwean
Immigration
NonimmigrantsImmigrantsAfghanistanAfricaAlbaniaArgentinaArmeniaAsiaAustraliaAustriaBahamasBangladeshBarbadosBelarusBelgiumBelizeBoliviaBosnia and HerzegovinaBrazilBulgariaBurma/MyanmarCabo VerdeCambodiaCameroonCanadaCaribbeanCentral AmericaChileChinaColombiaCongoCosta RicaCroatiaCubaCzechoslovakiaDenmarkDominicaDominican RepublicEastern AfricaEastern AsiaEastern EuropeEcuadorEgyptEl SalvadorEnglandEritreaEthiopiaEuropeFijiFranceGermanyGhanaGreeceGrenadaGuatemalaGuyanaHaitiHondurasHong KongHungaryIndiaIndonesiaIranIraqIrelandIsraelItalyJamaicaJapanJordanKazakhstanKenyaKoreaKuwaitLaosLatin AmericaLatviaLebanonLiberiaLithuaniaMalaysiaMexicoMicronesiaMiddle AfricaMoldovaMoroccoNepalNetherlandsNicaraguaNigeriaNorth AmericaNorth MacedoniaNorthern AfricaNorthern EuropeNorwayOceaniaPakistanPanamaPeruPhilippinesPolandPortugalRomaniaRussiaSaudi ArabiaScotlandSenegalSerbiaSierra LeoneSingaporeSomaliaSouth AfricaSouth AmericaSouth Central AsiaSouth Eastern AsiaSouthern EuropeSpainSri LankaSt. Vincent and the GrenadinesSudanSwedenSwitzerlandSyriaTaiwanThailandTrinidad and TobagoTurkeyUgandaUkraineUruguayUzbekistanVenezuelaVietnamWest IndiesWestern AfricaWestern AsiaWestern EuropeYemenZaireZimbabweAzores
Male Poverty
Income
Poverty
Unemployment
Labor Participation
Family Structure
Vehicle Availability
Education Level
Disability

Male Poverty Comparison

Hungarians

Samoans

Average
Good
11.1%
MALE POVERTY
55.1/ 100
METRIC RATING
167th/ 347
METRIC RANK
10.9%
MALE POVERTY
71.8/ 100
METRIC RATING
144th/ 347
METRIC RANK

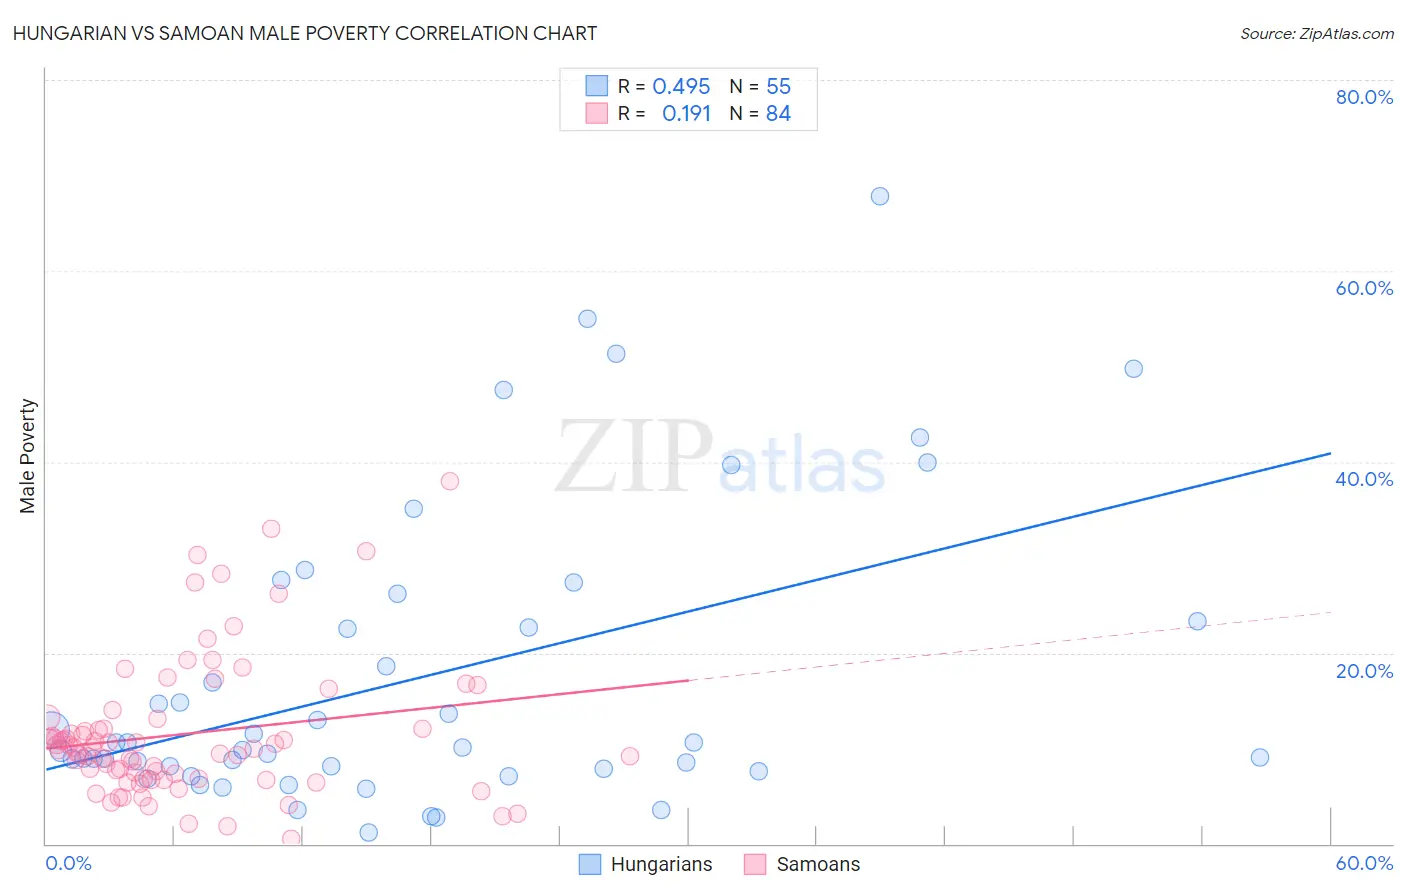
Hungarian vs Samoan Male Poverty Correlation Chart

The statistical analysis conducted on geographies consisting of 485,483,073 people shows a moderate positive correlation between the proportion of Hungarians and poverty level among males in the United States with a correlation coefficient (R) of 0.495 and weighted average of 11.1%. Similarly, the statistical analysis conducted on geographies consisting of 225,058,260 people shows a poor positive correlation between the proportion of Samoans and poverty level among males in the United States with a correlation coefficient (R) of 0.191 and weighted average of 10.9%, a difference of 1.8%.
Hungarian vs Samoan Male Poverty

Male Poverty Correlation Summary

MeasurementHungarianSamoan
Minimum1.2%0.57%
Maximum67.8%37.9%
Range66.6%37.3%
Mean17.3%11.5%
Median10.1%10.0%
Interquartile 25% (IQ1)7.8%6.8%
Interquartile 75% (IQ3)23.3%12.6%
Interquartile Range (IQR)15.4%5.8%
Standard Deviation (Sample)15.4%7.3%
Standard Deviation (Population)15.3%7.3%

Similar Demographics by Male Poverty

Demographics Similar to Hungarians by Male Poverty

In terms of male poverty, the demographic groups most similar to Hungarians are Immigrants from Albania (11.1%, a difference of 0.020%), Immigrants from Portugal (11.1%, a difference of 0.020%), Immigrants from Spain (11.1%, a difference of 0.040%), Immigrants from Colombia (11.1%, a difference of 0.090%), and South American (11.1%, a difference of 0.14%).
DemographicsRating | RankMale Poverty
Soviet Union
60.3
/100
|
#160
Good
11.1%
Immigrants | Northern Africa
59.7
/100
|
#161
Average
11.1%
Immigrants | Chile
57.4
/100
|
#162
Average
11.1%
Whites/Caucasians
56.7
/100
|
#163
Average
11.1%
Ethiopians
56.7
/100
|
#164
Average
11.1%
Immigrants | Spain
55.5
/100
|
#165
Average
11.1%
Immigrants | Albania
55.3
/100
|
#166
Average
11.1%
Hungarians
55.1
/100
|
#167
Average
11.1%
Immigrants | Portugal
54.9
/100
|
#168
Average
11.1%
Immigrants | Colombia
54.2
/100
|
#169
Average
11.1%
South Americans
53.8
/100
|
#170
Average
11.1%
Uruguayans
51.0
/100
|
#171
Average
11.2%
Immigrants | Ethiopia
50.7
/100
|
#172
Average
11.2%
Pennsylvania Germans
50.5
/100
|
#173
Average
11.2%
Immigrants | Oceania
50.0
/100
|
#174
Average
11.2%

Demographics Similar to Samoans by Male Poverty

In terms of male poverty, the demographic groups most similar to Samoans are Afghan (10.9%, a difference of 0.020%), Immigrants from Germany (10.9%, a difference of 0.020%), Syrian (10.9%, a difference of 0.050%), Basque (10.9%, a difference of 0.36%), and Icelander (11.0%, a difference of 0.39%).
DemographicsRating | RankMale Poverty
Immigrants | Switzerland
79.2
/100
|
#137
Good
10.8%
Yugoslavians
78.2
/100
|
#138
Good
10.8%
Immigrants | Jordan
77.5
/100
|
#139
Good
10.8%
Tlingit-Haida
76.1
/100
|
#140
Good
10.9%
Immigrants | France
75.8
/100
|
#141
Good
10.9%
Basques
74.6
/100
|
#142
Good
10.9%
Afghans
71.9
/100
|
#143
Good
10.9%
Samoans
71.8
/100
|
#144
Good
10.9%
Immigrants | Germany
71.6
/100
|
#145
Good
10.9%
Syrians
71.4
/100
|
#146
Good
10.9%
Icelanders
68.5
/100
|
#147
Good
11.0%
Armenians
68.0
/100
|
#148
Good
11.0%
Immigrants | Venezuela
67.9
/100
|
#149
Good
11.0%
Guamanians/Chamorros
67.6
/100
|
#150
Good
11.0%
Venezuelans
67.4
/100
|
#151
Good
11.0%