Hungarian vs Immigrants from Uzbekistan Seniors Poverty Over the Age of 75
COMPARE
Hungarian
Immigrants from Uzbekistan
Seniors Poverty Over the Age of 75
Seniors Poverty Over the Age of 75 Comparison
Hungarians
Immigrants from Uzbekistan
11.2%
SENIORS POVERTY OVER THE AGE OF 75
98.1/ 100
METRIC RATING
55th/ 347
METRIC RANK
16.5%
SENIORS POVERTY OVER THE AGE OF 75
0.0/ 100
METRIC RATING
324th/ 347
METRIC RANK
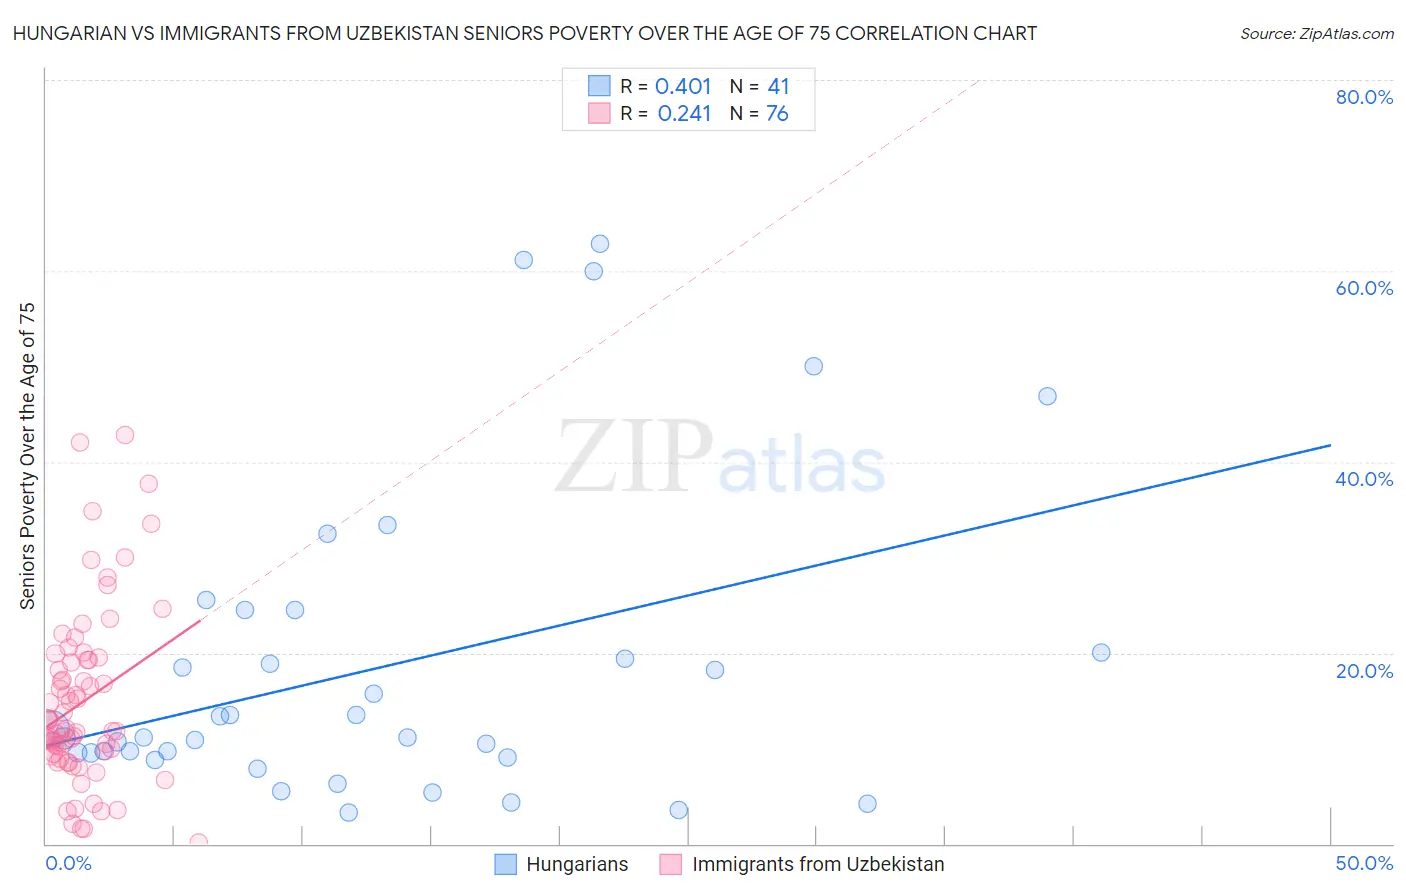
Hungarian vs Immigrants from Uzbekistan Seniors Poverty Over the Age of 75 Correlation Chart
The statistical analysis conducted on geographies consisting of 477,160,041 people shows a moderate positive correlation between the proportion of Hungarians and poverty level among seniors over the age of 75 in the United States with a correlation coefficient (R) of 0.401 and weighted average of 11.2%. Similarly, the statistical analysis conducted on geographies consisting of 118,161,446 people shows a weak positive correlation between the proportion of Immigrants from Uzbekistan and poverty level among seniors over the age of 75 in the United States with a correlation coefficient (R) of 0.241 and weighted average of 16.5%, a difference of 47.7%.
Seniors Poverty Over the Age of 75 Correlation Summary
| Measurement | Hungarian | Immigrants from Uzbekistan |
| Minimum | 3.3% | 0.17% |
| Maximum | 62.8% | 42.8% |
| Range | 59.5% | 42.6% |
| Mean | 18.4% | 14.8% |
| Median | 11.2% | 11.9% |
| Interquartile 25% (IQ1) | 9.3% | 9.3% |
| Interquartile 75% (IQ3) | 22.2% | 19.2% |
| Interquartile Range (IQR) | 12.9% | 9.9% |
| Standard Deviation (Sample) | 16.1% | 9.1% |
| Standard Deviation (Population) | 15.9% | 9.1% |
Similar Demographics by Seniors Poverty Over the Age of 75
Demographics Similar to Hungarians by Seniors Poverty Over the Age of 75
In terms of seniors poverty over the age of 75, the demographic groups most similar to Hungarians are Slavic (11.2%, a difference of 0.010%), Afghan (11.2%, a difference of 0.070%), Immigrants from Canada (11.2%, a difference of 0.24%), Yugoslavian (11.2%, a difference of 0.28%), and Immigrants from Netherlands (11.2%, a difference of 0.36%).
| Demographics | Rating | Rank | Seniors Poverty Over the Age of 75 |
| French | 98.7 /100 | #48 | Exceptional 11.1% |
| Samoans | 98.7 /100 | #49 | Exceptional 11.1% |
| Serbians | 98.6 /100 | #50 | Exceptional 11.1% |
| Immigrants | North Macedonia | 98.6 /100 | #51 | Exceptional 11.1% |
| Zimbabweans | 98.5 /100 | #52 | Exceptional 11.2% |
| Immigrants | England | 98.4 /100 | #53 | Exceptional 11.2% |
| Afghans | 98.2 /100 | #54 | Exceptional 11.2% |
| Hungarians | 98.1 /100 | #55 | Exceptional 11.2% |
| Slavs | 98.1 /100 | #56 | Exceptional 11.2% |
| Immigrants | Canada | 97.9 /100 | #57 | Exceptional 11.2% |
| Yugoslavians | 97.9 /100 | #58 | Exceptional 11.2% |
| Immigrants | Netherlands | 97.8 /100 | #59 | Exceptional 11.2% |
| Eastern Europeans | 97.7 /100 | #60 | Exceptional 11.3% |
| Canadians | 97.7 /100 | #61 | Exceptional 11.3% |
| Immigrants | North America | 97.6 /100 | #62 | Exceptional 11.3% |
Demographics Similar to Immigrants from Uzbekistan by Seniors Poverty Over the Age of 75
In terms of seniors poverty over the age of 75, the demographic groups most similar to Immigrants from Uzbekistan are Central American Indian (16.5%, a difference of 0.050%), Immigrants from Barbados (16.5%, a difference of 0.14%), Immigrants from Haiti (16.5%, a difference of 0.16%), Immigrants from Yemen (16.5%, a difference of 0.35%), and Nicaraguan (16.6%, a difference of 0.38%).
| Demographics | Rating | Rank | Seniors Poverty Over the Age of 75 |
| Immigrants | Guyana | 0.0 /100 | #317 | Tragic 16.2% |
| Houma | 0.0 /100 | #318 | Tragic 16.2% |
| Haitians | 0.0 /100 | #319 | Tragic 16.2% |
| Immigrants | Yemen | 0.0 /100 | #320 | Tragic 16.5% |
| Immigrants | Haiti | 0.0 /100 | #321 | Tragic 16.5% |
| Immigrants | Barbados | 0.0 /100 | #322 | Tragic 16.5% |
| Central American Indians | 0.0 /100 | #323 | Tragic 16.5% |
| Immigrants | Uzbekistan | 0.0 /100 | #324 | Tragic 16.5% |
| Nicaraguans | 0.0 /100 | #325 | Tragic 16.6% |
| Pueblo | 0.0 /100 | #326 | Tragic 16.7% |
| Sioux | 0.0 /100 | #327 | Tragic 16.8% |
| Cape Verdeans | 0.0 /100 | #328 | Tragic 16.8% |
| Immigrants | Dominica | 0.0 /100 | #329 | Tragic 17.0% |
| British West Indians | 0.0 /100 | #330 | Tragic 17.4% |
| Immigrants | Armenia | 0.0 /100 | #331 | Tragic 17.5% |