Hungarian vs Immigrants from Poland Single Male Poverty

COMPARE

Hungarian
Race
Ancestry
AfghanAfricanAlaska NativeAlaskan AthabascanAlbanianAleutAlsatianAmericanApacheArabArapahoArgentineanArmenianAssyrian/Chaldean/SyriacAustralianAustrianBahamianBangladeshiBarbadianBasqueBelgianBelizeanBermudanBhutaneseBlackfeetBolivianBrazilianBritishBritish West IndianBulgarianBurmeseCajunCambodianCanadianCape VerdeanCarpatho RusynCelticCentral AmericanCentral American IndianCherokeeCheyenneChickasawChileanChineseChippewaChoctawColombianColvilleComancheCosta RicanCreeCreekCroatianCrowCubanCypriotCzechCzechoslovakianDanishDelawareDominicanDutchDutch West IndianEastern EuropeanEcuadorianEgyptianEnglishEstonianEthiopianEuropeanFijianFilipinoFinnishFrenchFrench American IndianFrench CanadianGermanGerman RussianGhanaianGreekGuamanian/ChamorroGuatemalanGuyaneseHaitianHmongHonduranHopiHoumaHungarianIcelanderIndian (Asian)IndonesianInupiatIranianIraqiIrishIroquoisIsraeliItalianJamaicanJapaneseJordanianKenyanKiowaKoreanLaotianLatvianLebaneseLiberianLithuanianLumbeeLuxembourgerMacedonianMalaysianMalteseMarshalleseMenomineeMexicanMexican American IndianMongolianMoroccanNative HawaiianNavajoNepaleseNew ZealanderNicaraguanNigerianNorthern EuropeanNorwegianOkinawanOsageOttawaPaiutePakistaniPalestinianPanamanianParaguayanPennsylvania GermanPeruvianPimaPolishPortuguesePotawatomiPuebloPuerto RicanPuget Sound SalishRomanianRussianSalvadoranSamoanScandinavianScotch-IrishScottishSeminoleSenegaleseSerbianShoshoneSierra LeoneanSiouxSlavicSlovakSloveneSomaliSouth AfricanSouth AmericanSouth American IndianSoviet UnionSpaniardSpanishSpanish AmericanSpanish American IndianSri LankanSubsaharan AfricanSudaneseSwedishSwissSyrianTaiwaneseThaiTlingit-HaidaTohono O'OdhamTonganTrinidadian and TobagonianTsimshianTurkishU.S. Virgin IslanderUgandanUkrainianUruguayanUteVenezuelanVietnameseWelshWest IndianYakamaYaquiYugoslavianYumanYup'ikZimbabwean
Immigration
NonimmigrantsImmigrantsAfghanistanAfricaAlbaniaArgentinaArmeniaAsiaAustraliaAustriaBahamasBangladeshBarbadosBelarusBelgiumBelizeBoliviaBosnia and HerzegovinaBrazilBulgariaBurma/MyanmarCabo VerdeCambodiaCameroonCanadaCaribbeanCentral AmericaChileChinaColombiaCongoCosta RicaCroatiaCubaCzechoslovakiaDenmarkDominicaDominican RepublicEastern AfricaEastern AsiaEastern EuropeEcuadorEgyptEl SalvadorEnglandEritreaEthiopiaEuropeFijiFranceGermanyGhanaGreeceGrenadaGuatemalaGuyanaHaitiHondurasHong KongHungaryIndiaIndonesiaIranIraqIrelandIsraelItalyJamaicaJapanJordanKazakhstanKenyaKoreaKuwaitLaosLatin AmericaLatviaLebanonLiberiaLithuaniaMalaysiaMexicoMicronesiaMiddle AfricaMoldovaMoroccoNepalNetherlandsNicaraguaNigeriaNorth AmericaNorth MacedoniaNorthern AfricaNorthern EuropeNorwayOceaniaPakistanPanamaPeruPhilippinesPortugalRomaniaRussiaSaudi ArabiaScotlandSenegalSerbiaSierra LeoneSingaporeSomaliaSouth AfricaSouth AmericaSouth Central AsiaSouth Eastern AsiaSouthern EuropeSpainSri LankaSt. Vincent and the GrenadinesSudanSwedenSwitzerlandSyriaTaiwanThailandTrinidad and TobagoTurkeyUgandaUkraineUruguayUzbekistanVenezuelaVietnamWest IndiesWestern AfricaWestern AsiaWestern EuropeYemenZaireZimbabweAzores
Immigrants from Poland
Race
Ancestry
AfghanAfricanAlaska NativeAlaskan AthabascanAlbanianAleutAlsatianAmericanApacheArabArapahoArgentineanArmenianAssyrian/Chaldean/SyriacAustralianAustrianBahamianBangladeshiBarbadianBasqueBelgianBelizeanBermudanBhutaneseBlackfeetBolivianBrazilianBritishBritish West IndianBulgarianBurmeseCajunCambodianCanadianCape VerdeanCarpatho RusynCelticCentral AmericanCentral American IndianCherokeeCheyenneChickasawChileanChineseChippewaChoctawColombianColvilleComancheCosta RicanCreeCreekCroatianCrowCubanCypriotCzechCzechoslovakianDanishDelawareDominicanDutchDutch West IndianEastern EuropeanEcuadorianEgyptianEnglishEstonianEthiopianEuropeanFijianFilipinoFinnishFrenchFrench American IndianFrench CanadianGermanGerman RussianGhanaianGreekGuamanian/ChamorroGuatemalanGuyaneseHaitianHmongHonduranHopiHoumaIcelanderIndian (Asian)IndonesianInupiatIranianIraqiIrishIroquoisIsraeliItalianJamaicanJapaneseJordanianKenyanKiowaKoreanLaotianLatvianLebaneseLiberianLithuanianLumbeeLuxembourgerMacedonianMalaysianMalteseMarshalleseMenomineeMexicanMexican American IndianMongolianMoroccanNative HawaiianNavajoNepaleseNew ZealanderNicaraguanNigerianNorthern EuropeanNorwegianOkinawanOsageOttawaPaiutePakistaniPalestinianPanamanianParaguayanPennsylvania GermanPeruvianPimaPolishPortuguesePotawatomiPuebloPuerto RicanPuget Sound SalishRomanianRussianSalvadoranSamoanScandinavianScotch-IrishScottishSeminoleSenegaleseSerbianShoshoneSierra LeoneanSiouxSlavicSlovakSloveneSomaliSouth AfricanSouth AmericanSouth American IndianSoviet UnionSpaniardSpanishSpanish AmericanSpanish American IndianSri LankanSubsaharan AfricanSudaneseSwedishSwissSyrianTaiwaneseThaiTlingit-HaidaTohono O'OdhamTonganTrinidadian and TobagonianTsimshianTurkishU.S. Virgin IslanderUgandanUkrainianUruguayanUteVenezuelanVietnameseWelshWest IndianYakamaYaquiYugoslavianYumanYup'ikZimbabwean
Immigration
NonimmigrantsImmigrantsAfghanistanAfricaAlbaniaArgentinaArmeniaAsiaAustraliaAustriaBahamasBangladeshBarbadosBelarusBelgiumBelizeBoliviaBosnia and HerzegovinaBrazilBulgariaBurma/MyanmarCabo VerdeCambodiaCameroonCanadaCaribbeanCentral AmericaChileChinaColombiaCongoCosta RicaCroatiaCubaCzechoslovakiaDenmarkDominicaDominican RepublicEastern AfricaEastern AsiaEastern EuropeEcuadorEgyptEl SalvadorEnglandEritreaEthiopiaEuropeFijiFranceGermanyGhanaGreeceGrenadaGuatemalaGuyanaHaitiHondurasHong KongHungaryIndiaIndonesiaIranIraqIrelandIsraelItalyJamaicaJapanJordanKazakhstanKenyaKoreaKuwaitLaosLatin AmericaLatviaLebanonLiberiaLithuaniaMalaysiaMexicoMicronesiaMiddle AfricaMoldovaMoroccoNepalNetherlandsNicaraguaNigeriaNorth AmericaNorth MacedoniaNorthern AfricaNorthern EuropeNorwayOceaniaPakistanPanamaPeruPhilippinesPolandPortugalRomaniaRussiaSaudi ArabiaScotlandSenegalSerbiaSierra LeoneSingaporeSomaliaSouth AfricaSouth AmericaSouth Central AsiaSouth Eastern AsiaSouthern EuropeSpainSri LankaSt. Vincent and the GrenadinesSudanSwedenSwitzerlandSyriaTaiwanThailandTrinidad and TobagoTurkeyUgandaUkraineUruguayUzbekistanVenezuelaVietnamWest IndiesWestern AfricaWestern AsiaWestern EuropeYemenZaireZimbabweAzores
Single Male Poverty
Income
Poverty
Unemployment
Labor Participation
Family Structure
Vehicle Availability
Education Level
Disability

Single Male Poverty Comparison

Hungarians

Immigrants from Poland

Tragic
Exceptional
13.8%
SINGLE MALE POVERTY
0.3/ 100
METRIC RATING
261st/ 347
METRIC RANK
11.5%
SINGLE MALE POVERTY
99.9/ 100
METRIC RATING
45th/ 347
METRIC RANK

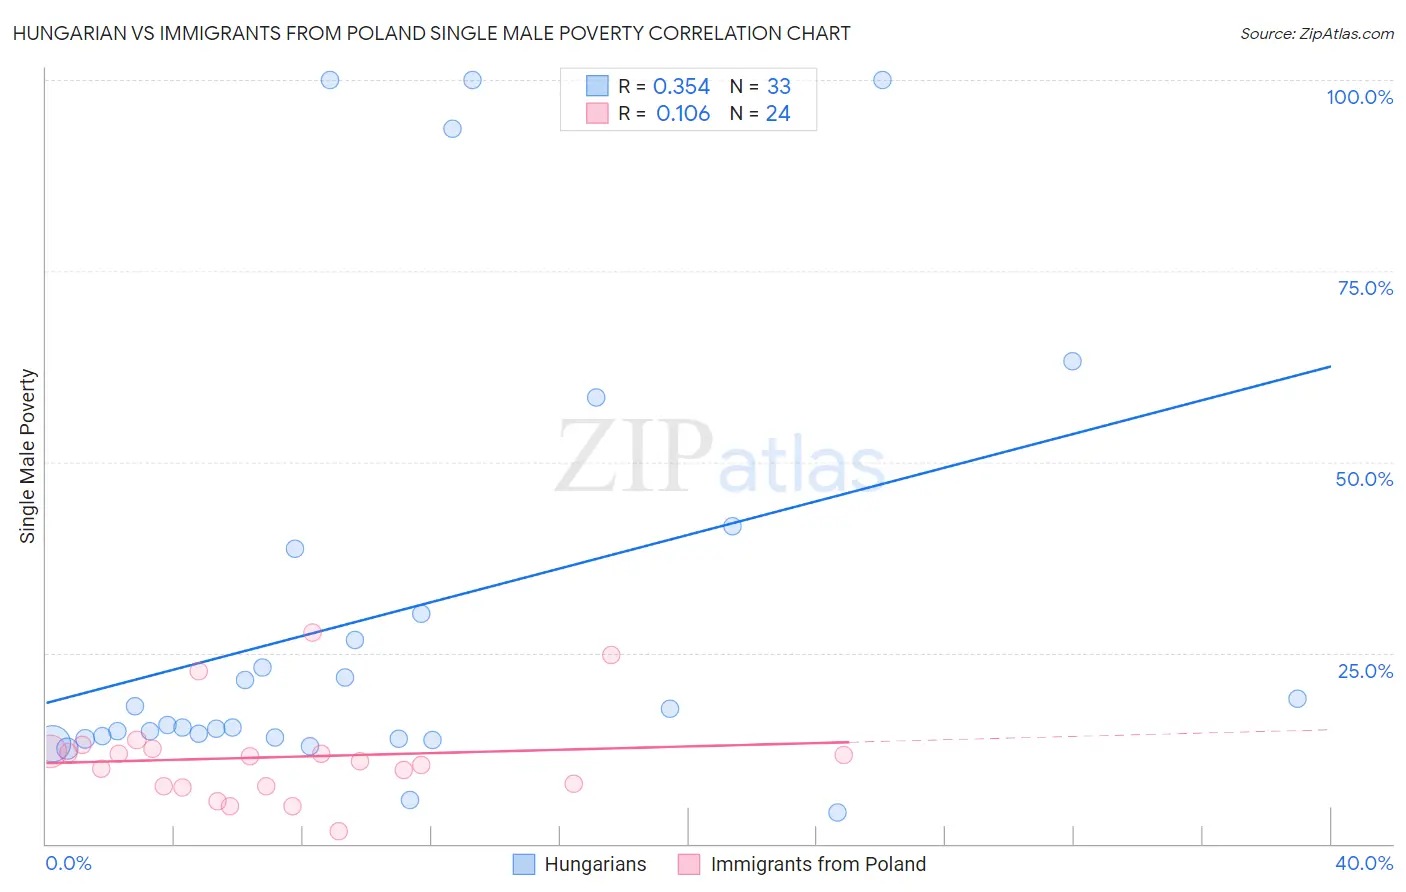
Hungarian vs Immigrants from Poland Single Male Poverty Correlation Chart

The statistical analysis conducted on geographies consisting of 413,693,148 people shows a mild positive correlation between the proportion of Hungarians and poverty level among single males in the United States with a correlation coefficient (R) of 0.354 and weighted average of 13.8%. Similarly, the statistical analysis conducted on geographies consisting of 269,525,262 people shows a poor positive correlation between the proportion of Immigrants from Poland and poverty level among single males in the United States with a correlation coefficient (R) of 0.106 and weighted average of 11.5%, a difference of 19.3%.
Hungarian vs Immigrants from Poland Single Male Poverty

Single Male Poverty Correlation Summary

MeasurementHungarianImmigrants from Poland
Minimum4.0%1.6%
Maximum100.0%27.7%
Range96.0%26.1%
Mean30.2%11.4%
Median15.5%11.1%
Interquartile 25% (IQ1)13.9%7.6%
Interquartile 75% (IQ3)34.3%12.2%
Interquartile Range (IQR)20.5%4.7%
Standard Deviation (Sample)28.8%6.1%
Standard Deviation (Population)28.4%6.0%

Similar Demographics by Single Male Poverty

Demographics Similar to Hungarians by Single Male Poverty

In terms of single male poverty, the demographic groups most similar to Hungarians are Swiss (13.8%, a difference of 0.050%), Guatemalan (13.8%, a difference of 0.12%), Immigrants from Guatemala (13.8%, a difference of 0.16%), Fijian (13.8%, a difference of 0.17%), and Immigrants from Central America (13.8%, a difference of 0.23%).
DemographicsRating | RankSingle Male Poverty
Sub-Saharan Africans
0.5
/100
|
#254
Tragic
13.7%
Spaniards
0.4
/100
|
#255
Tragic
13.7%
Immigrants | Belize
0.4
/100
|
#256
Tragic
13.7%
Immigrants | Central America
0.3
/100
|
#257
Tragic
13.8%
Immigrants | Guatemala
0.3
/100
|
#258
Tragic
13.8%
Guatemalans
0.3
/100
|
#259
Tragic
13.8%
Swiss
0.3
/100
|
#260
Tragic
13.8%
Hungarians
0.3
/100
|
#261
Tragic
13.8%
Fijians
0.3
/100
|
#262
Tragic
13.8%
Cape Verdeans
0.2
/100
|
#263
Tragic
13.8%
West Indians
0.2
/100
|
#264
Tragic
13.8%
Immigrants | Congo
0.2
/100
|
#265
Tragic
13.9%
Immigrants | Cabo Verde
0.1
/100
|
#266
Tragic
13.9%
Germans
0.1
/100
|
#267
Tragic
13.9%
Immigrants | Mexico
0.1
/100
|
#268
Tragic
13.9%

Demographics Similar to Immigrants from Poland by Single Male Poverty

In terms of single male poverty, the demographic groups most similar to Immigrants from Poland are Immigrants from Cameroon (11.5%, a difference of 0.020%), Immigrants from Peru (11.5%, a difference of 0.030%), Immigrants from Bulgaria (11.6%, a difference of 0.13%), Egyptian (11.5%, a difference of 0.18%), and Immigrants from Iraq (11.5%, a difference of 0.23%).
DemographicsRating | RankSingle Male Poverty
Sri Lankans
100.0
/100
|
#38
Exceptional
11.5%
Soviet Union
100.0
/100
|
#39
Exceptional
11.5%
Immigrants | Korea
100.0
/100
|
#40
Exceptional
11.5%
Immigrants | Iraq
99.9
/100
|
#41
Exceptional
11.5%
Egyptians
99.9
/100
|
#42
Exceptional
11.5%
Immigrants | Peru
99.9
/100
|
#43
Exceptional
11.5%
Immigrants | Cameroon
99.9
/100
|
#44
Exceptional
11.5%
Immigrants | Poland
99.9
/100
|
#45
Exceptional
11.5%
Immigrants | Bulgaria
99.9
/100
|
#46
Exceptional
11.6%
Nepalese
99.9
/100
|
#47
Exceptional
11.6%
Immigrants | Indonesia
99.9
/100
|
#48
Exceptional
11.6%
Tlingit-Haida
99.9
/100
|
#49
Exceptional
11.6%
Immigrants | Lithuania
99.9
/100
|
#50
Exceptional
11.6%
Paraguayans
99.9
/100
|
#51
Exceptional
11.6%
Samoans
99.9
/100
|
#52
Exceptional
11.7%