Houma vs Colombian Child Poverty Under the Age of 5
COMPARE
Houma
Colombian
Child Poverty Under the Age of 5
Child Poverty Under the Age of 5 Comparison
Houma
Colombians
22.7%
CHILD POVERTY UNDER THE AGE OF 5
0.0/ 100
METRIC RATING
309th/ 347
METRIC RANK
16.7%
CHILD POVERTY UNDER THE AGE OF 5
77.8/ 100
METRIC RATING
150th/ 347
METRIC RANK
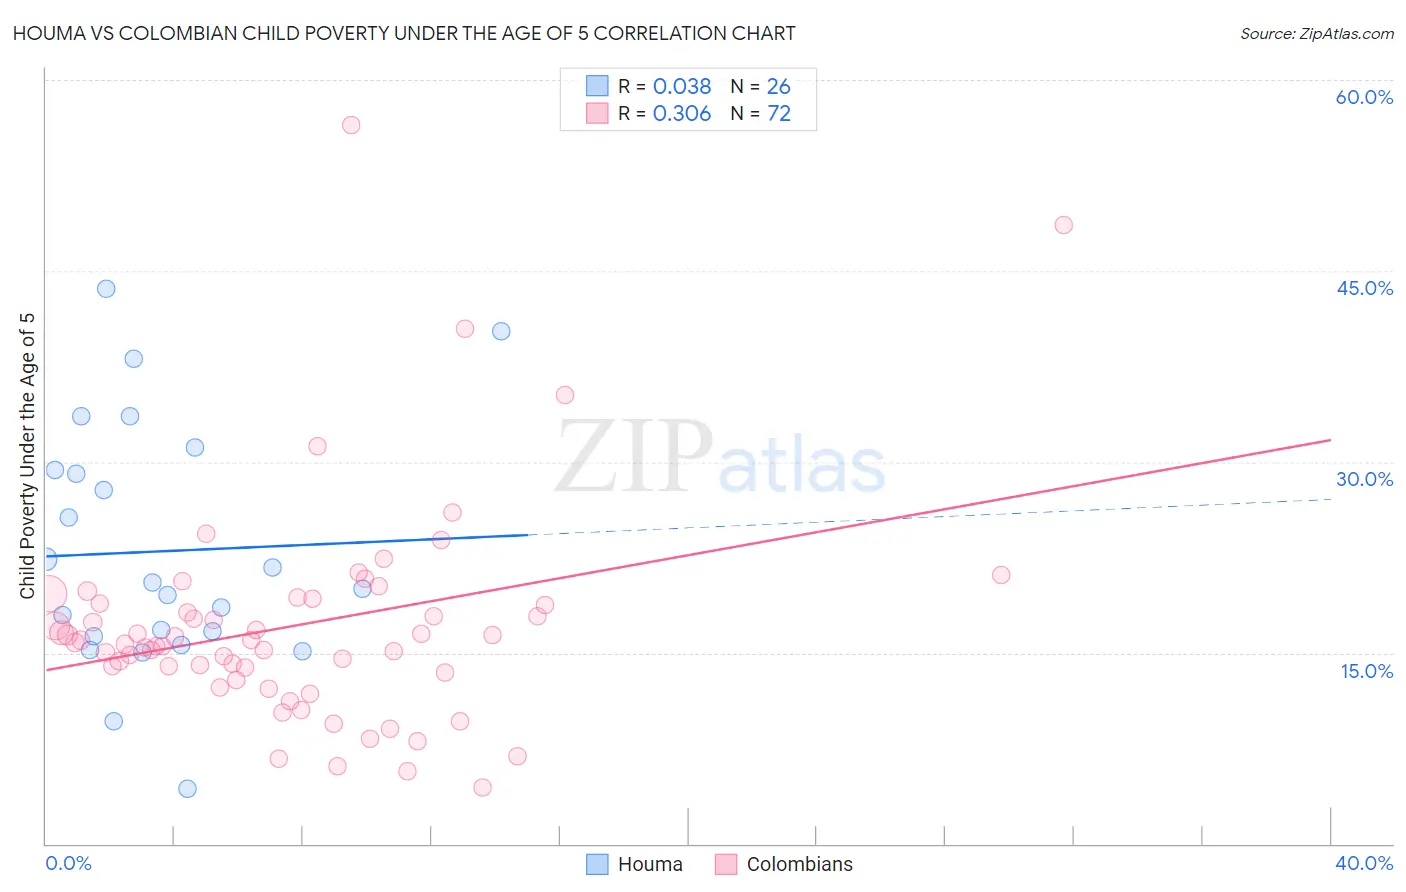
Houma vs Colombian Child Poverty Under the Age of 5 Correlation Chart
The statistical analysis conducted on geographies consisting of 36,619,572 people shows no correlation between the proportion of Houma and poverty level among children under the age of 5 in the United States with a correlation coefficient (R) of 0.038 and weighted average of 22.7%. Similarly, the statistical analysis conducted on geographies consisting of 402,400,688 people shows a mild positive correlation between the proportion of Colombians and poverty level among children under the age of 5 in the United States with a correlation coefficient (R) of 0.306 and weighted average of 16.7%, a difference of 36.3%.
Child Poverty Under the Age of 5 Correlation Summary
| Measurement | Houma | Colombian |
| Minimum | 4.3% | 4.4% |
| Maximum | 43.6% | 56.5% |
| Range | 39.3% | 52.0% |
| Mean | 23.0% | 17.1% |
| Median | 20.3% | 15.9% |
| Interquartile 25% (IQ1) | 16.3% | 13.6% |
| Interquartile 75% (IQ3) | 29.4% | 19.1% |
| Interquartile Range (IQR) | 13.1% | 5.4% |
| Standard Deviation (Sample) | 9.6% | 8.6% |
| Standard Deviation (Population) | 9.4% | 8.5% |
Similar Demographics by Child Poverty Under the Age of 5
Demographics Similar to Houma by Child Poverty Under the Age of 5
In terms of child poverty under the age of 5, the demographic groups most similar to Houma are Immigrants from Dominica (22.7%, a difference of 0.14%), Immigrants from Bahamas (22.7%, a difference of 0.18%), African (22.8%, a difference of 0.41%), Seminole (22.8%, a difference of 0.45%), and Honduran (23.0%, a difference of 1.1%).
| Demographics | Rating | Rank | Child Poverty Under the Age of 5 |
| Iroquois | 0.0 /100 | #302 | Tragic 22.0% |
| Inupiat | 0.0 /100 | #303 | Tragic 22.0% |
| Immigrants | Guatemala | 0.0 /100 | #304 | Tragic 22.0% |
| Immigrants | Mexico | 0.0 /100 | #305 | Tragic 22.2% |
| Indonesians | 0.0 /100 | #306 | Tragic 22.3% |
| Immigrants | Bahamas | 0.0 /100 | #307 | Tragic 22.7% |
| Immigrants | Dominica | 0.0 /100 | #308 | Tragic 22.7% |
| Houma | 0.0 /100 | #309 | Tragic 22.7% |
| Africans | 0.0 /100 | #310 | Tragic 22.8% |
| Seminole | 0.0 /100 | #311 | Tragic 22.8% |
| Hondurans | 0.0 /100 | #312 | Tragic 23.0% |
| Bahamians | 0.0 /100 | #313 | Tragic 23.0% |
| U.S. Virgin Islanders | 0.0 /100 | #314 | Tragic 23.0% |
| Arapaho | 0.0 /100 | #315 | Tragic 23.1% |
| Yakama | 0.0 /100 | #316 | Tragic 23.1% |
Demographics Similar to Colombians by Child Poverty Under the Age of 5
In terms of child poverty under the age of 5, the demographic groups most similar to Colombians are Canadian (16.7%, a difference of 0.030%), Belgian (16.7%, a difference of 0.10%), Dutch (16.7%, a difference of 0.11%), New Zealander (16.6%, a difference of 0.14%), and Syrian (16.6%, a difference of 0.20%).
| Demographics | Rating | Rank | Child Poverty Under the Age of 5 |
| Samoans | 83.0 /100 | #143 | Excellent 16.5% |
| Ethiopians | 82.7 /100 | #144 | Excellent 16.5% |
| Immigrants | Ethiopia | 82.1 /100 | #145 | Excellent 16.6% |
| Israelis | 82.0 /100 | #146 | Excellent 16.6% |
| Immigrants | Nepal | 80.3 /100 | #147 | Excellent 16.6% |
| Syrians | 79.1 /100 | #148 | Good 16.6% |
| New Zealanders | 78.7 /100 | #149 | Good 16.6% |
| Colombians | 77.8 /100 | #150 | Good 16.7% |
| Canadians | 77.6 /100 | #151 | Good 16.7% |
| Belgians | 77.2 /100 | #152 | Good 16.7% |
| Dutch | 77.1 /100 | #153 | Good 16.7% |
| Immigrants | Venezuela | 76.0 /100 | #154 | Good 16.7% |
| South Americans | 75.1 /100 | #155 | Good 16.7% |
| Afghans | 74.4 /100 | #156 | Good 16.8% |
| Venezuelans | 73.7 /100 | #157 | Good 16.8% |