Hopi vs Salvadoran Single Male Poverty

COMPARE

Hopi
Race
Ancestry
AfghanAfricanAlaska NativeAlaskan AthabascanAlbanianAleutAlsatianAmericanApacheArabArapahoArgentineanArmenianAssyrian/Chaldean/SyriacAustralianAustrianBahamianBangladeshiBarbadianBasqueBelgianBelizeanBermudanBhutaneseBlackfeetBolivianBrazilianBritishBritish West IndianBulgarianBurmeseCajunCambodianCanadianCape VerdeanCarpatho RusynCelticCentral AmericanCentral American IndianCherokeeCheyenneChickasawChileanChineseChippewaChoctawColombianColvilleComancheCosta RicanCreeCreekCroatianCrowCubanCypriotCzechCzechoslovakianDanishDelawareDominicanDutchDutch West IndianEastern EuropeanEcuadorianEgyptianEnglishEstonianEthiopianEuropeanFijianFilipinoFinnishFrenchFrench American IndianFrench CanadianGermanGerman RussianGhanaianGreekGuamanian/ChamorroGuatemalanGuyaneseHaitianHmongHonduranHopiHoumaHungarianIcelanderIndian (Asian)IndonesianInupiatIranianIraqiIrishIroquoisIsraeliItalianJamaicanJapaneseJordanianKenyanKiowaKoreanLaotianLatvianLebaneseLiberianLithuanianLumbeeLuxembourgerMacedonianMalaysianMalteseMarshalleseMenomineeMexicanMexican American IndianMongolianMoroccanNative HawaiianNavajoNepaleseNew ZealanderNicaraguanNigerianNorthern EuropeanNorwegianOkinawanOsageOttawaPaiutePakistaniPalestinianPanamanianParaguayanPennsylvania GermanPeruvianPimaPolishPortuguesePotawatomiPuebloPuerto RicanPuget Sound SalishRomanianRussianSamoanScandinavianScotch-IrishScottishSeminoleSenegaleseSerbianShoshoneSierra LeoneanSiouxSlavicSlovakSloveneSomaliSouth AfricanSouth AmericanSouth American IndianSoviet UnionSpaniardSpanishSpanish AmericanSpanish American IndianSri LankanSubsaharan AfricanSudaneseSwedishSwissSyrianTaiwaneseThaiTlingit-HaidaTohono O'OdhamTonganTrinidadian and TobagonianTsimshianTurkishU.S. Virgin IslanderUgandanUkrainianUruguayanUteVenezuelanVietnameseWelshWest IndianYakamaYaquiYugoslavianYumanYup'ikZimbabwean
Immigration
NonimmigrantsImmigrantsAfghanistanAfricaAlbaniaArgentinaArmeniaAsiaAustraliaAustriaBahamasBangladeshBarbadosBelarusBelgiumBelizeBoliviaBosnia and HerzegovinaBrazilBulgariaBurma/MyanmarCabo VerdeCambodiaCameroonCanadaCaribbeanCentral AmericaChileChinaColombiaCongoCosta RicaCroatiaCubaCzechoslovakiaDenmarkDominicaDominican RepublicEastern AfricaEastern AsiaEastern EuropeEcuadorEgyptEl SalvadorEnglandEritreaEthiopiaEuropeFijiFranceGermanyGhanaGreeceGrenadaGuatemalaGuyanaHaitiHondurasHong KongHungaryIndiaIndonesiaIranIraqIrelandIsraelItalyJamaicaJapanJordanKazakhstanKenyaKoreaKuwaitLaosLatin AmericaLatviaLebanonLiberiaLithuaniaMalaysiaMexicoMicronesiaMiddle AfricaMoldovaMoroccoNepalNetherlandsNicaraguaNigeriaNorth AmericaNorth MacedoniaNorthern AfricaNorthern EuropeNorwayOceaniaPakistanPanamaPeruPhilippinesPolandPortugalRomaniaRussiaSaudi ArabiaScotlandSenegalSerbiaSierra LeoneSingaporeSomaliaSouth AfricaSouth AmericaSouth Central AsiaSouth Eastern AsiaSouthern EuropeSpainSri LankaSt. Vincent and the GrenadinesSudanSwedenSwitzerlandSyriaTaiwanThailandTrinidad and TobagoTurkeyUgandaUkraineUruguayUzbekistanVenezuelaVietnamWest IndiesWestern AfricaWestern AsiaWestern EuropeYemenZaireZimbabweAzores
Salvadoran
Race
Ancestry
AfghanAfricanAlaska NativeAlaskan AthabascanAlbanianAleutAlsatianAmericanApacheArabArapahoArgentineanArmenianAssyrian/Chaldean/SyriacAustralianAustrianBahamianBangladeshiBarbadianBasqueBelgianBelizeanBermudanBhutaneseBlackfeetBolivianBrazilianBritishBritish West IndianBulgarianBurmeseCajunCambodianCanadianCape VerdeanCarpatho RusynCelticCentral AmericanCentral American IndianCherokeeCheyenneChickasawChileanChineseChippewaChoctawColombianColvilleComancheCosta RicanCreeCreekCroatianCrowCubanCypriotCzechCzechoslovakianDanishDelawareDominicanDutchDutch West IndianEastern EuropeanEcuadorianEgyptianEnglishEstonianEthiopianEuropeanFijianFilipinoFinnishFrenchFrench American IndianFrench CanadianGermanGerman RussianGhanaianGreekGuamanian/ChamorroGuatemalanGuyaneseHaitianHmongHonduranHoumaHungarianIcelanderIndian (Asian)IndonesianInupiatIranianIraqiIrishIroquoisIsraeliItalianJamaicanJapaneseJordanianKenyanKiowaKoreanLaotianLatvianLebaneseLiberianLithuanianLumbeeLuxembourgerMacedonianMalaysianMalteseMarshalleseMenomineeMexicanMexican American IndianMongolianMoroccanNative HawaiianNavajoNepaleseNew ZealanderNicaraguanNigerianNorthern EuropeanNorwegianOkinawanOsageOttawaPaiutePakistaniPalestinianPanamanianParaguayanPennsylvania GermanPeruvianPimaPolishPortuguesePotawatomiPuebloPuerto RicanPuget Sound SalishRomanianRussianSalvadoranSamoanScandinavianScotch-IrishScottishSeminoleSenegaleseSerbianShoshoneSierra LeoneanSiouxSlavicSlovakSloveneSomaliSouth AfricanSouth AmericanSouth American IndianSoviet UnionSpaniardSpanishSpanish AmericanSpanish American IndianSri LankanSubsaharan AfricanSudaneseSwedishSwissSyrianTaiwaneseThaiTlingit-HaidaTohono O'OdhamTonganTrinidadian and TobagonianTsimshianTurkishU.S. Virgin IslanderUgandanUkrainianUruguayanUteVenezuelanVietnameseWelshWest IndianYakamaYaquiYugoslavianYumanYup'ikZimbabwean
Immigration
NonimmigrantsImmigrantsAfghanistanAfricaAlbaniaArgentinaArmeniaAsiaAustraliaAustriaBahamasBangladeshBarbadosBelarusBelgiumBelizeBoliviaBosnia and HerzegovinaBrazilBulgariaBurma/MyanmarCabo VerdeCambodiaCameroonCanadaCaribbeanCentral AmericaChileChinaColombiaCongoCosta RicaCroatiaCubaCzechoslovakiaDenmarkDominicaDominican RepublicEastern AfricaEastern AsiaEastern EuropeEcuadorEgyptEl SalvadorEnglandEritreaEthiopiaEuropeFijiFranceGermanyGhanaGreeceGrenadaGuatemalaGuyanaHaitiHondurasHong KongHungaryIndiaIndonesiaIranIraqIrelandIsraelItalyJamaicaJapanJordanKazakhstanKenyaKoreaKuwaitLaosLatin AmericaLatviaLebanonLiberiaLithuaniaMalaysiaMexicoMicronesiaMiddle AfricaMoldovaMoroccoNepalNetherlandsNicaraguaNigeriaNorth AmericaNorth MacedoniaNorthern AfricaNorthern EuropeNorwayOceaniaPakistanPanamaPeruPhilippinesPolandPortugalRomaniaRussiaSaudi ArabiaScotlandSenegalSerbiaSierra LeoneSingaporeSomaliaSouth AfricaSouth AmericaSouth Central AsiaSouth Eastern AsiaSouthern EuropeSpainSri LankaSt. Vincent and the GrenadinesSudanSwedenSwitzerlandSyriaTaiwanThailandTrinidad and TobagoTurkeyUgandaUkraineUruguayUzbekistanVenezuelaVietnamWest IndiesWestern AfricaWestern AsiaWestern EuropeYemenZaireZimbabweAzores
Single Male Poverty
Income
Poverty
Unemployment
Labor Participation
Family Structure
Vehicle Availability
Education Level
Disability

Single Male Poverty Comparison

Hopi

Salvadorans

Tragic
Excellent
27.5%
SINGLE MALE POVERTY
0.0/ 100
METRIC RATING
346th/ 347
METRIC RANK
12.5%
SINGLE MALE POVERTY
83.7/ 100
METRIC RATING
132nd/ 347
METRIC RANK

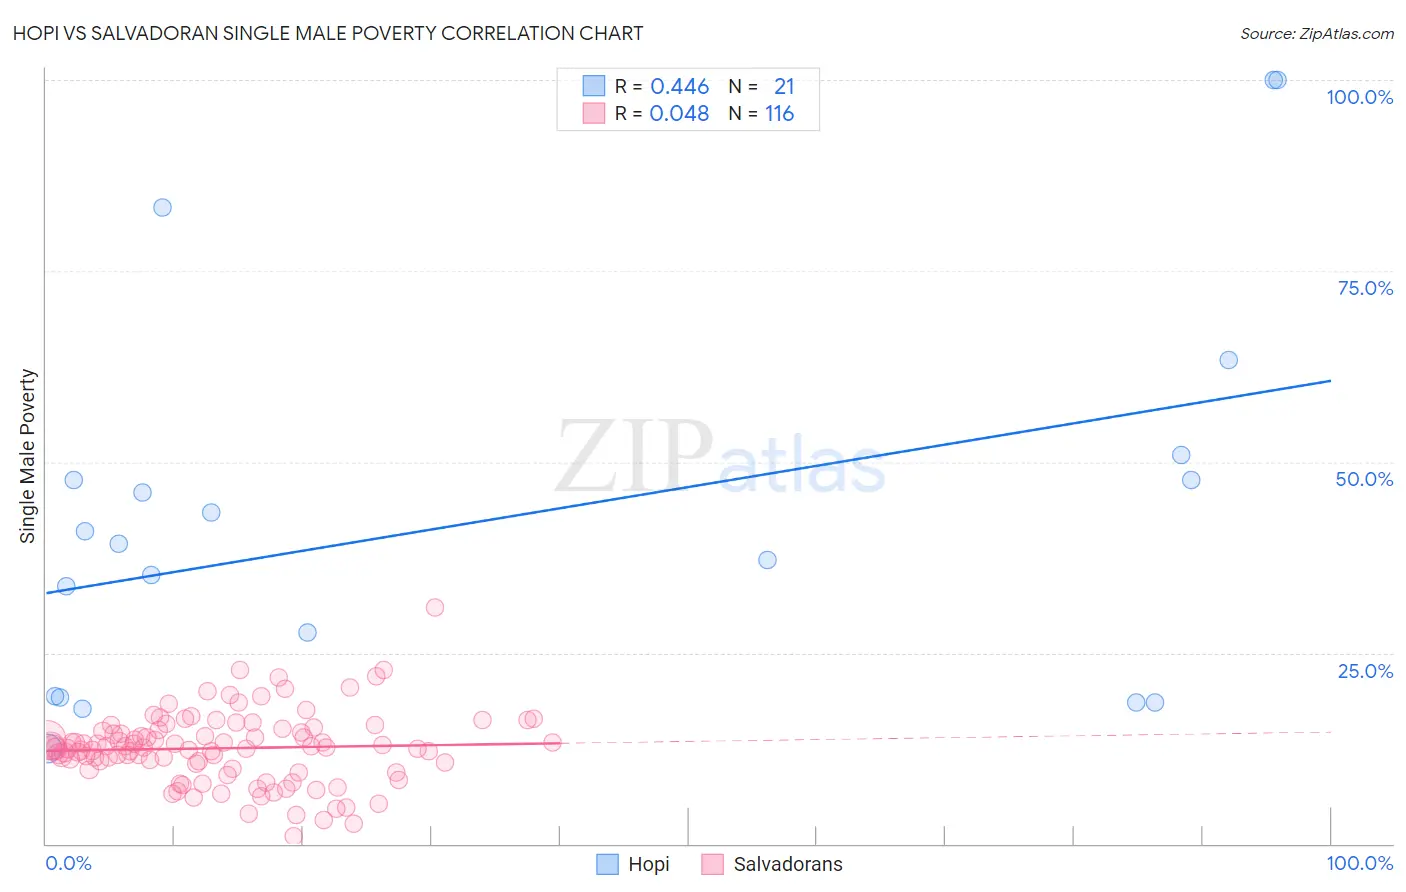
Hopi vs Salvadoran Single Male Poverty Correlation Chart

The statistical analysis conducted on geographies consisting of 72,721,636 people shows a moderate positive correlation between the proportion of Hopi and poverty level among single males in the United States with a correlation coefficient (R) of 0.446 and weighted average of 27.5%. Similarly, the statistical analysis conducted on geographies consisting of 358,837,331 people shows no correlation between the proportion of Salvadorans and poverty level among single males in the United States with a correlation coefficient (R) of 0.048 and weighted average of 12.5%, a difference of 119.6%.
Hopi vs Salvadoran Single Male Poverty

Single Male Poverty Correlation Summary

MeasurementHopiSalvadoran
Minimum12.4%1.0%
Maximum100.0%30.9%
Range87.6%29.9%
Mean42.9%12.5%
Median39.3%12.6%
Interquartile 25% (IQ1)19.3%10.2%
Interquartile 75% (IQ3)49.3%14.9%
Interquartile Range (IQR)30.0%4.7%
Standard Deviation (Sample)25.5%4.7%
Standard Deviation (Population)24.9%4.6%

Similar Demographics by Single Male Poverty

Demographics Similar to Hopi by Single Male Poverty

In terms of single male poverty, the demographic groups most similar to Hopi are Navajo (25.3%, a difference of 8.5%), Lumbee (25.2%, a difference of 9.3%), Puerto Rican (25.1%, a difference of 9.7%), Yup'ik (31.6%, a difference of 15.0%), and Houma (23.5%, a difference of 17.3%).
DemographicsRating | RankSingle Male Poverty
Inupiat
0.0
/100
|
#333
Tragic
20.0%
Pima
0.0
/100
|
#334
Tragic
20.2%
Yuman
0.0
/100
|
#335
Tragic
21.3%
Tohono O'odham
0.0
/100
|
#336
Tragic
21.6%
Apache
0.0
/100
|
#337
Tragic
21.6%
Pueblo
0.0
/100
|
#338
Tragic
21.6%
Arapaho
0.0
/100
|
#339
Tragic
21.9%
Sioux
0.0
/100
|
#340
Tragic
22.2%
Crow
0.0
/100
|
#341
Tragic
23.3%
Houma
0.0
/100
|
#342
Tragic
23.5%
Puerto Ricans
0.0
/100
|
#343
Tragic
25.1%
Lumbee
0.0
/100
|
#344
Tragic
25.2%
Navajo
0.0
/100
|
#345
Tragic
25.3%
Hopi
0.0
/100
|
#346
Tragic
27.5%
Yup'ik
0.0
/100
|
#347
Tragic
31.6%

Demographics Similar to Salvadorans by Single Male Poverty

In terms of single male poverty, the demographic groups most similar to Salvadorans are Immigrants from Northern Europe (12.5%, a difference of 0.0%), Immigrants from Western Asia (12.5%, a difference of 0.030%), Immigrants from Nicaragua (12.5%, a difference of 0.12%), Immigrants from Ecuador (12.5%, a difference of 0.15%), and Immigrants from Costa Rica (12.5%, a difference of 0.17%).
DemographicsRating | RankSingle Male Poverty
Immigrants | Jordan
87.1
/100
|
#125
Excellent
12.5%
Romanians
86.4
/100
|
#126
Excellent
12.5%
Immigrants | Netherlands
86.2
/100
|
#127
Excellent
12.5%
Ecuadorians
85.9
/100
|
#128
Excellent
12.5%
Immigrants | Sierra Leone
85.5
/100
|
#129
Excellent
12.5%
Immigrants | Nicaragua
84.8
/100
|
#130
Excellent
12.5%
Immigrants | Northern Europe
83.7
/100
|
#131
Excellent
12.5%
Salvadorans
83.7
/100
|
#132
Excellent
12.5%
Immigrants | Western Asia
83.4
/100
|
#133
Excellent
12.5%
Immigrants | Ecuador
82.1
/100
|
#134
Excellent
12.5%
Immigrants | Costa Rica
81.9
/100
|
#135
Excellent
12.5%
Immigrants | Austria
81.9
/100
|
#136
Excellent
12.5%
Ukrainians
80.7
/100
|
#137
Excellent
12.6%
Immigrants | El Salvador
80.0
/100
|
#138
Excellent
12.6%
Cubans
79.9
/100
|
#139
Good
12.6%