Hopi vs Immigrants from Western Africa Single Father Poverty
COMPARE
Hopi
Immigrants from Western Africa
Single Father Poverty
Single Father Poverty Comparison
Hopi
Immigrants from Western Africa
27.2%
SINGLE FATHER POVERTY
0.0/ 100
METRIC RATING
341st/ 347
METRIC RANK
16.4%
SINGLE FATHER POVERTY
36.0/ 100
METRIC RATING
181st/ 347
METRIC RANK
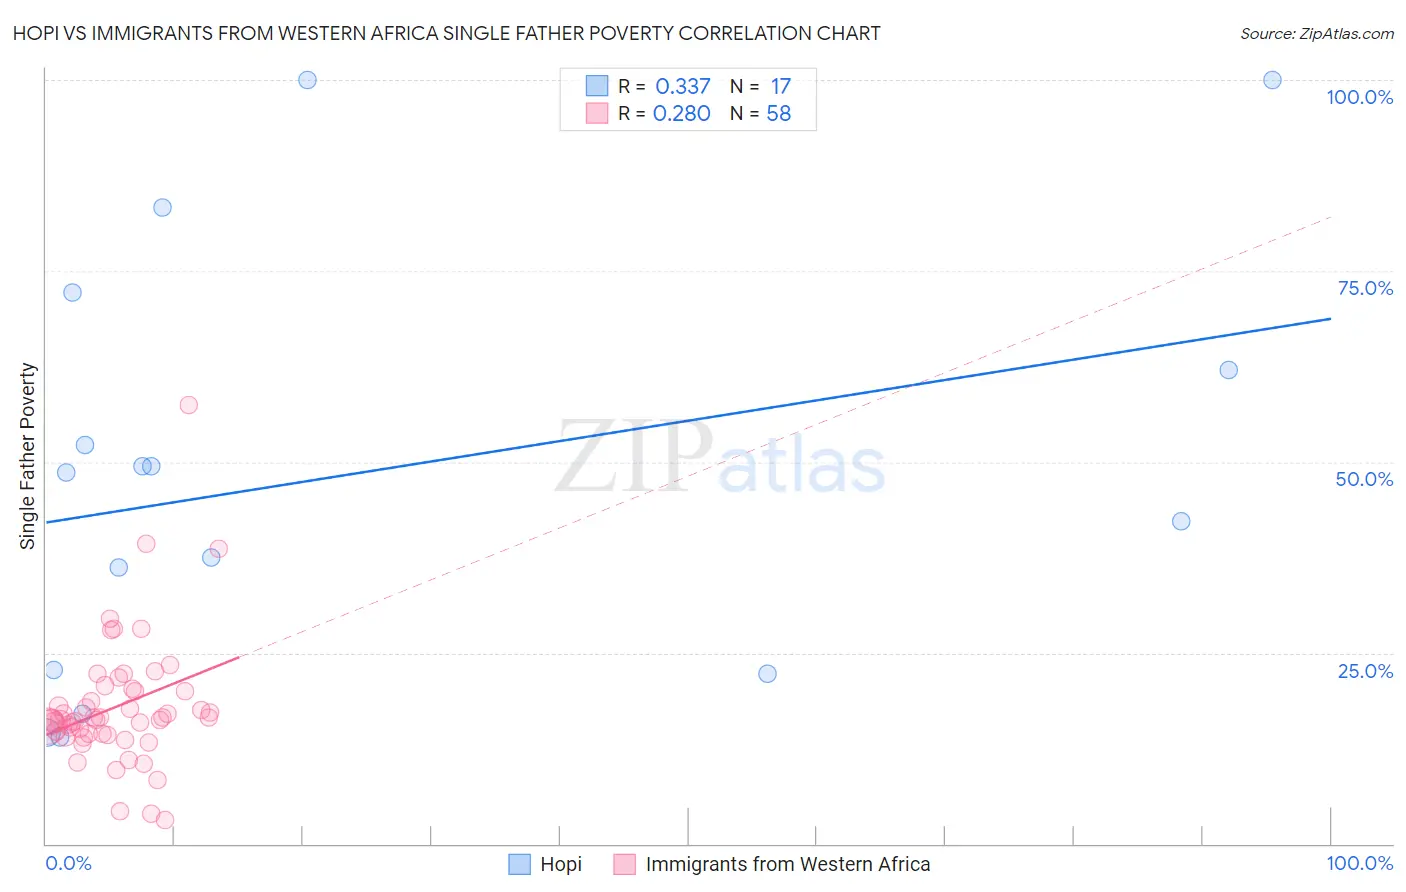
Hopi vs Immigrants from Western Africa Single Father Poverty Correlation Chart
The statistical analysis conducted on geographies consisting of 69,635,854 people shows a mild positive correlation between the proportion of Hopi and poverty level among single fathers in the United States with a correlation coefficient (R) of 0.337 and weighted average of 27.2%. Similarly, the statistical analysis conducted on geographies consisting of 289,916,705 people shows a weak positive correlation between the proportion of Immigrants from Western Africa and poverty level among single fathers in the United States with a correlation coefficient (R) of 0.280 and weighted average of 16.4%, a difference of 65.6%.
Single Father Poverty Correlation Summary
| Measurement | Hopi | Immigrants from Western Africa |
| Minimum | 14.0% | 3.1% |
| Maximum | 100.0% | 57.4% |
| Range | 86.0% | 54.4% |
| Mean | 48.4% | 18.0% |
| Median | 48.6% | 16.2% |
| Interquartile 25% (IQ1) | 22.5% | 14.4% |
| Interquartile 75% (IQ3) | 67.1% | 20.0% |
| Interquartile Range (IQR) | 44.7% | 5.5% |
| Standard Deviation (Sample) | 27.7% | 8.5% |
| Standard Deviation (Population) | 26.9% | 8.5% |
Similar Demographics by Single Father Poverty
Demographics Similar to Hopi by Single Father Poverty
In terms of single father poverty, the demographic groups most similar to Hopi are Houma (26.7%, a difference of 1.6%), Yuman (28.4%, a difference of 4.5%), Lumbee (28.5%, a difference of 4.9%), Navajo (29.2%, a difference of 7.6%), and Crow (30.3%, a difference of 11.5%).
| Demographics | Rating | Rank | Single Father Poverty |
| Natives/Alaskans | 0.0 /100 | #333 | Tragic 22.4% |
| Kiowa | 0.0 /100 | #334 | Tragic 22.5% |
| Shoshone | 0.0 /100 | #335 | Tragic 22.9% |
| Cajuns | 0.0 /100 | #336 | Tragic 23.1% |
| Sioux | 0.0 /100 | #337 | Tragic 23.9% |
| Arapaho | 0.0 /100 | #338 | Tragic 24.0% |
| Apache | 0.0 /100 | #339 | Tragic 24.2% |
| Houma | 0.0 /100 | #340 | Tragic 26.7% |
| Hopi | 0.0 /100 | #341 | Tragic 27.2% |
| Yuman | 0.0 /100 | #342 | Tragic 28.4% |
| Lumbee | 0.0 /100 | #343 | Tragic 28.5% |
| Navajo | 0.0 /100 | #344 | Tragic 29.2% |
| Crow | 0.0 /100 | #345 | Tragic 30.3% |
| Puerto Ricans | 0.0 /100 | #346 | Tragic 31.5% |
| Yup'ik | 0.0 /100 | #347 | Tragic 32.5% |
Demographics Similar to Immigrants from Western Africa by Single Father Poverty
In terms of single father poverty, the demographic groups most similar to Immigrants from Western Africa are Immigrants from Italy (16.4%, a difference of 0.010%), Aleut (16.4%, a difference of 0.030%), Immigrants from Latin America (16.4%, a difference of 0.060%), Cambodian (16.4%, a difference of 0.060%), and Panamanian (16.4%, a difference of 0.12%).
| Demographics | Rating | Rank | Single Father Poverty |
| Swedes | 50.0 /100 | #174 | Average 16.3% |
| Immigrants | Ecuador | 49.7 /100 | #175 | Average 16.3% |
| Vietnamese | 48.0 /100 | #176 | Average 16.3% |
| Immigrants | South Africa | 44.2 /100 | #177 | Average 16.3% |
| Immigrants | Cuba | 41.6 /100 | #178 | Average 16.4% |
| Serbians | 40.9 /100 | #179 | Average 16.4% |
| Immigrants | Latin America | 37.2 /100 | #180 | Fair 16.4% |
| Immigrants | Western Africa | 36.0 /100 | #181 | Fair 16.4% |
| Immigrants | Italy | 35.7 /100 | #182 | Fair 16.4% |
| Aleuts | 35.3 /100 | #183 | Fair 16.4% |
| Cambodians | 34.6 /100 | #184 | Fair 16.4% |
| Panamanians | 33.6 /100 | #185 | Fair 16.4% |
| Immigrants | Venezuela | 31.0 /100 | #186 | Fair 16.4% |
| Ukrainians | 30.4 /100 | #187 | Fair 16.4% |
| Russians | 30.1 /100 | #188 | Fair 16.4% |