Hopi vs Immigrants from Jordan Single Female Poverty
COMPARE
Hopi
Immigrants from Jordan
Single Female Poverty
Single Female Poverty Comparison
Hopi
Immigrants from Jordan
28.0%
SINGLE FEMALE POVERTY
0.0/ 100
METRIC RATING
330th/ 347
METRIC RANK
19.3%
SINGLE FEMALE POVERTY
99.4/ 100
METRIC RATING
70th/ 347
METRIC RANK
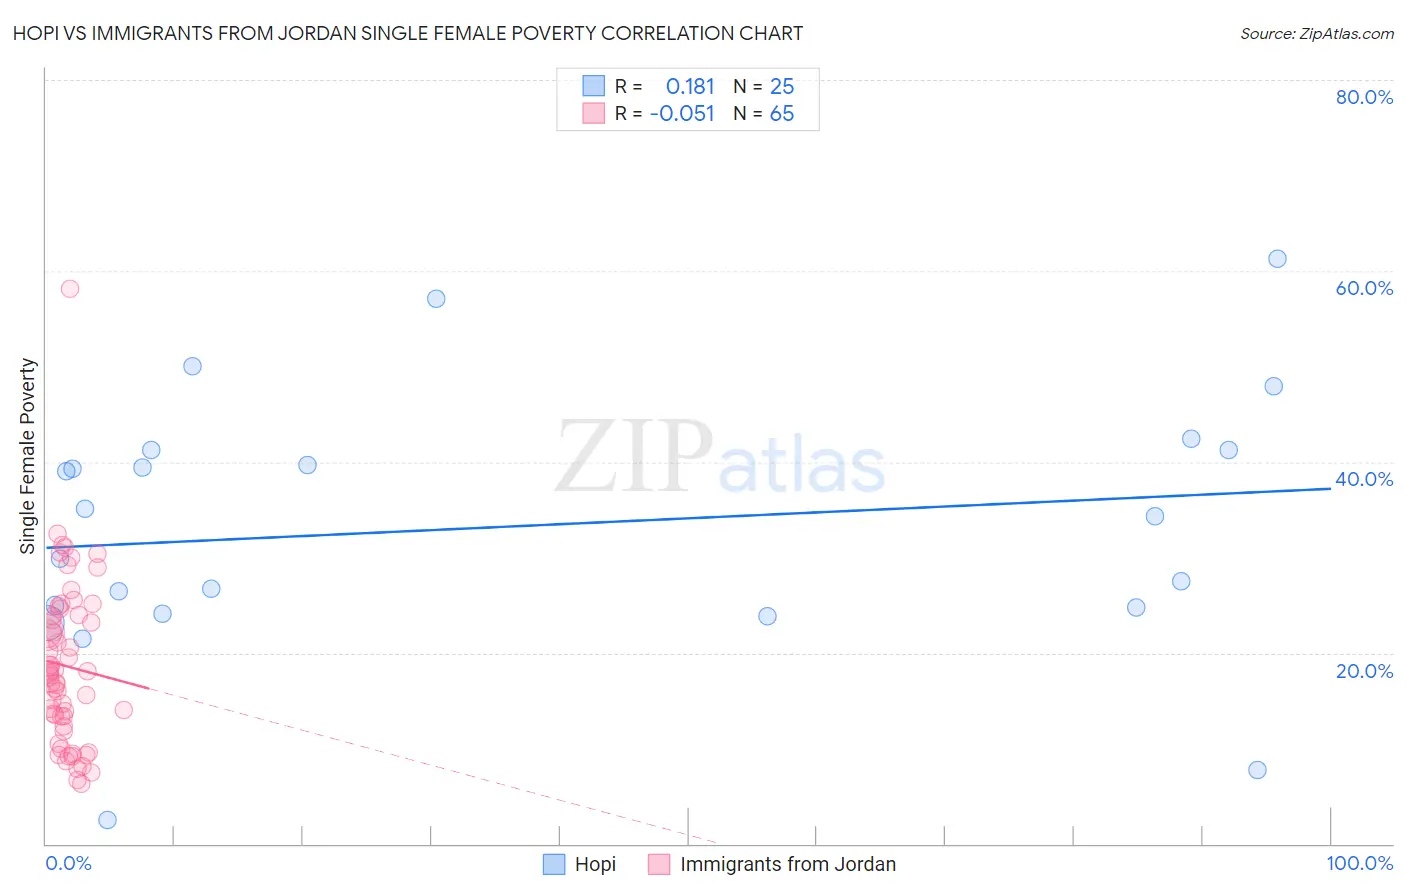
Hopi vs Immigrants from Jordan Single Female Poverty Correlation Chart
The statistical analysis conducted on geographies consisting of 74,526,987 people shows a poor positive correlation between the proportion of Hopi and poverty level among single females in the United States with a correlation coefficient (R) of 0.181 and weighted average of 28.0%. Similarly, the statistical analysis conducted on geographies consisting of 180,238,780 people shows a slight negative correlation between the proportion of Immigrants from Jordan and poverty level among single females in the United States with a correlation coefficient (R) of -0.051 and weighted average of 19.3%, a difference of 45.2%.
Single Female Poverty Correlation Summary
| Measurement | Hopi | Immigrants from Jordan |
| Minimum | 2.4% | 6.2% |
| Maximum | 61.3% | 58.2% |
| Range | 58.9% | 51.9% |
| Mean | 33.2% | 18.6% |
| Median | 34.3% | 17.8% |
| Interquartile 25% (IQ1) | 24.4% | 12.8% |
| Interquartile 75% (IQ3) | 41.2% | 23.9% |
| Interquartile Range (IQR) | 16.8% | 11.1% |
| Standard Deviation (Sample) | 13.7% | 8.7% |
| Standard Deviation (Population) | 13.4% | 8.6% |
Similar Demographics by Single Female Poverty
Demographics Similar to Hopi by Single Female Poverty
In terms of single female poverty, the demographic groups most similar to Hopi are Native/Alaskan (28.2%, a difference of 0.64%), Menominee (27.8%, a difference of 0.71%), Yakama (28.3%, a difference of 0.90%), Apache (27.7%, a difference of 1.2%), and Ute (28.4%, a difference of 1.3%).
| Demographics | Rating | Rank | Single Female Poverty |
| Chippewa | 0.0 /100 | #323 | Tragic 26.8% |
| Kiowa | 0.0 /100 | #324 | Tragic 26.9% |
| Choctaw | 0.0 /100 | #325 | Tragic 27.2% |
| Creek | 0.0 /100 | #326 | Tragic 27.4% |
| Dutch West Indians | 0.0 /100 | #327 | Tragic 27.5% |
| Apache | 0.0 /100 | #328 | Tragic 27.7% |
| Menominee | 0.0 /100 | #329 | Tragic 27.8% |
| Hopi | 0.0 /100 | #330 | Tragic 28.0% |
| Natives/Alaskans | 0.0 /100 | #331 | Tragic 28.2% |
| Yakama | 0.0 /100 | #332 | Tragic 28.3% |
| Ute | 0.0 /100 | #333 | Tragic 28.4% |
| Pueblo | 0.0 /100 | #334 | Tragic 28.6% |
| Immigrants | Yemen | 0.0 /100 | #335 | Tragic 28.9% |
| Colville | 0.0 /100 | #336 | Tragic 29.1% |
| Yuman | 0.0 /100 | #337 | Tragic 29.4% |
Demographics Similar to Immigrants from Jordan by Single Female Poverty
In terms of single female poverty, the demographic groups most similar to Immigrants from Jordan are Paraguayan (19.3%, a difference of 0.060%), Immigrants from South Eastern Asia (19.3%, a difference of 0.070%), Immigrants from Latvia (19.3%, a difference of 0.070%), Immigrants from Peru (19.3%, a difference of 0.17%), and Immigrants from Belarus (19.3%, a difference of 0.19%).
| Demographics | Rating | Rank | Single Female Poverty |
| Immigrants | Northern Europe | 99.6 /100 | #63 | Exceptional 19.2% |
| Immigrants | Europe | 99.6 /100 | #64 | Exceptional 19.2% |
| Cypriots | 99.6 /100 | #65 | Exceptional 19.2% |
| Palestinians | 99.6 /100 | #66 | Exceptional 19.2% |
| Immigrants | Egypt | 99.6 /100 | #67 | Exceptional 19.2% |
| Laotians | 99.5 /100 | #68 | Exceptional 19.3% |
| Paraguayans | 99.5 /100 | #69 | Exceptional 19.3% |
| Immigrants | Jordan | 99.4 /100 | #70 | Exceptional 19.3% |
| Immigrants | South Eastern Asia | 99.4 /100 | #71 | Exceptional 19.3% |
| Immigrants | Latvia | 99.4 /100 | #72 | Exceptional 19.3% |
| Immigrants | Peru | 99.4 /100 | #73 | Exceptional 19.3% |
| Immigrants | Belarus | 99.4 /100 | #74 | Exceptional 19.3% |
| Immigrants | Turkey | 99.4 /100 | #75 | Exceptional 19.4% |
| Peruvians | 99.4 /100 | #76 | Exceptional 19.4% |
| Immigrants | Russia | 99.3 /100 | #77 | Exceptional 19.4% |