Hopi vs Immigrants from Barbados Family Poverty
COMPARE
Hopi
Immigrants from Barbados
Family Poverty
Family Poverty Comparison
Hopi
Immigrants from Barbados
15.9%
FAMILY POVERTY
0.0/ 100
METRIC RATING
337th/ 347
METRIC RANK
11.5%
FAMILY POVERTY
0.0/ 100
METRIC RATING
289th/ 347
METRIC RANK
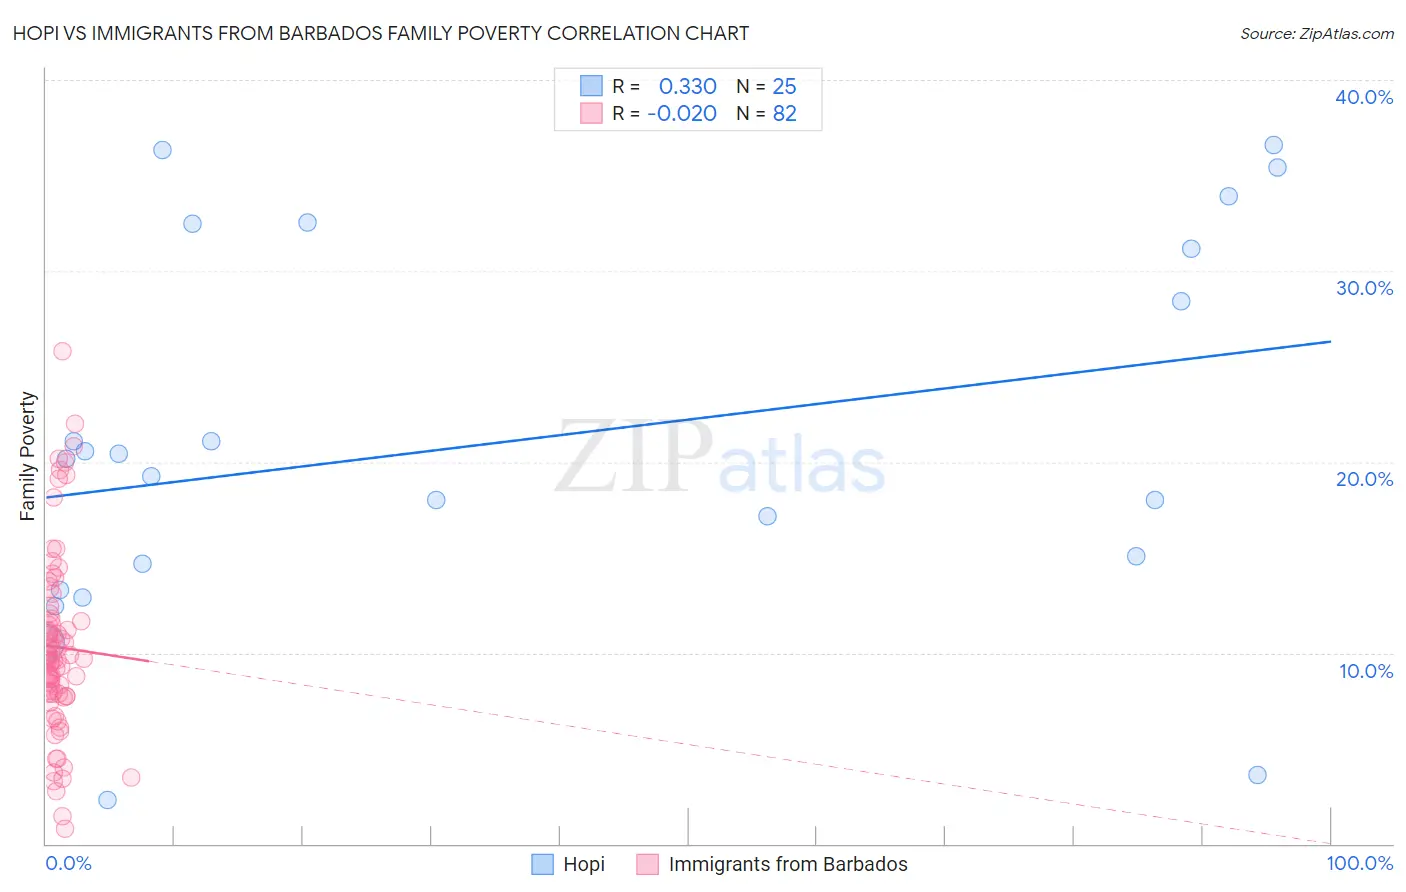
Hopi vs Immigrants from Barbados Family Poverty Correlation Chart
The statistical analysis conducted on geographies consisting of 74,712,354 people shows a mild positive correlation between the proportion of Hopi and poverty level among families in the United States with a correlation coefficient (R) of 0.330 and weighted average of 15.9%. Similarly, the statistical analysis conducted on geographies consisting of 112,741,244 people shows no correlation between the proportion of Immigrants from Barbados and poverty level among families in the United States with a correlation coefficient (R) of -0.020 and weighted average of 11.5%, a difference of 38.2%.
Family Poverty Correlation Summary
| Measurement | Hopi | Immigrants from Barbados |
| Minimum | 2.3% | 0.78% |
| Maximum | 36.6% | 25.8% |
| Range | 34.3% | 25.0% |
| Mean | 21.1% | 10.3% |
| Median | 20.1% | 9.7% |
| Interquartile 25% (IQ1) | 14.0% | 7.8% |
| Interquartile 75% (IQ3) | 31.8% | 11.8% |
| Interquartile Range (IQR) | 17.8% | 4.0% |
| Standard Deviation (Sample) | 9.9% | 4.8% |
| Standard Deviation (Population) | 9.7% | 4.8% |
Similar Demographics by Family Poverty
Demographics Similar to Hopi by Family Poverty
In terms of family poverty, the demographic groups most similar to Hopi are Sioux (15.9%, a difference of 0.47%), Crow (16.1%, a difference of 1.1%), Yuman (16.6%, a difference of 4.5%), Pueblo (17.0%, a difference of 6.6%), and Lumbee (17.0%, a difference of 6.7%).
| Demographics | Rating | Rank | Family Poverty |
| Natives/Alaskans | 0.0 /100 | #330 | Tragic 14.3% |
| Cheyenne | 0.0 /100 | #331 | Tragic 14.3% |
| Dominicans | 0.0 /100 | #332 | Tragic 14.3% |
| Immigrants | Dominican Republic | 0.0 /100 | #333 | Tragic 14.4% |
| Houma | 0.0 /100 | #334 | Tragic 14.6% |
| Apache | 0.0 /100 | #335 | Tragic 14.7% |
| Sioux | 0.0 /100 | #336 | Tragic 15.9% |
| Hopi | 0.0 /100 | #337 | Tragic 15.9% |
| Crow | 0.0 /100 | #338 | Tragic 16.1% |
| Yuman | 0.0 /100 | #339 | Tragic 16.6% |
| Pueblo | 0.0 /100 | #340 | Tragic 17.0% |
| Lumbee | 0.0 /100 | #341 | Tragic 17.0% |
| Immigrants | Yemen | 0.0 /100 | #342 | Tragic 17.5% |
| Pima | 0.0 /100 | #343 | Tragic 18.4% |
| Yup'ik | 0.0 /100 | #344 | Tragic 18.7% |
Demographics Similar to Immigrants from Barbados by Family Poverty
In terms of family poverty, the demographic groups most similar to Immigrants from Barbados are West Indian (11.5%, a difference of 0.010%), Immigrants from Belize (11.5%, a difference of 0.050%), Haitian (11.5%, a difference of 0.070%), Immigrants from Somalia (11.5%, a difference of 0.18%), and Vietnamese (11.5%, a difference of 0.24%).
| Demographics | Rating | Rank | Family Poverty |
| Immigrants | Cuba | 0.0 /100 | #282 | Tragic 11.3% |
| Indonesians | 0.0 /100 | #283 | Tragic 11.3% |
| Yaqui | 0.0 /100 | #284 | Tragic 11.3% |
| Barbadians | 0.0 /100 | #285 | Tragic 11.3% |
| Senegalese | 0.0 /100 | #286 | Tragic 11.5% |
| Vietnamese | 0.0 /100 | #287 | Tragic 11.5% |
| Immigrants | Belize | 0.0 /100 | #288 | Tragic 11.5% |
| Immigrants | Barbados | 0.0 /100 | #289 | Tragic 11.5% |
| West Indians | 0.0 /100 | #290 | Tragic 11.5% |
| Haitians | 0.0 /100 | #291 | Tragic 11.5% |
| Immigrants | Somalia | 0.0 /100 | #292 | Tragic 11.5% |
| Immigrants | Cabo Verde | 0.0 /100 | #293 | Tragic 11.6% |
| Immigrants | St. Vincent and the Grenadines | 0.0 /100 | #294 | Tragic 11.6% |
| Immigrants | Haiti | 0.0 /100 | #295 | Tragic 11.6% |
| Choctaw | 0.0 /100 | #296 | Tragic 11.6% |