Honduran vs Iraqi Child Poverty Under the Age of 16
COMPARE
Honduran
Iraqi
Child Poverty Under the Age of 16
Child Poverty Under the Age of 16 Comparison
Hondurans
Iraqis
22.2%
CHILD POVERTY UNDER THE AGE OF 16
0.0/ 100
METRIC RATING
322nd/ 347
METRIC RANK
17.5%
CHILD POVERTY UNDER THE AGE OF 16
5.9/ 100
METRIC RATING
214th/ 347
METRIC RANK
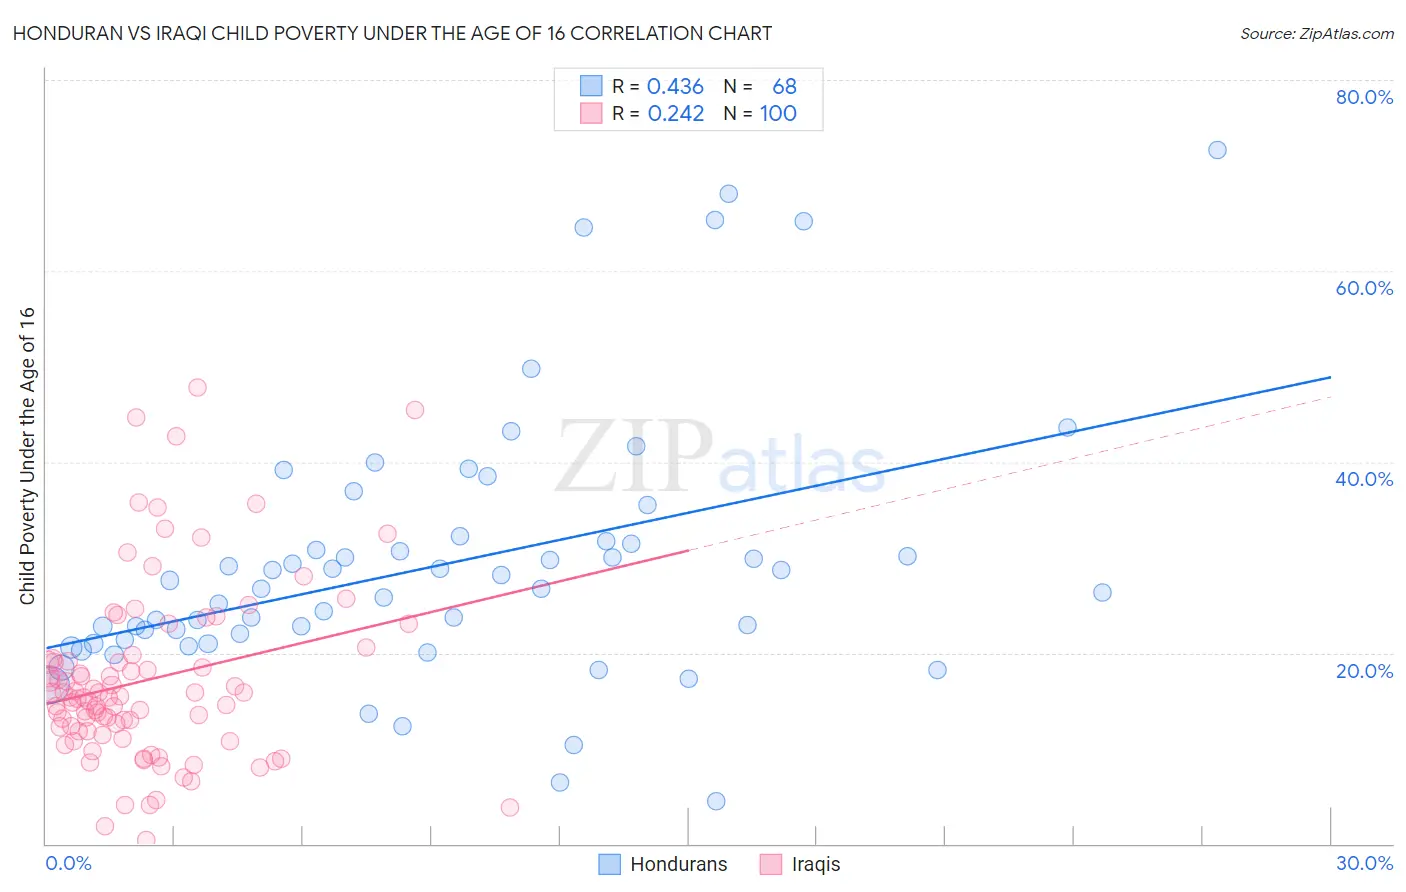
Honduran vs Iraqi Child Poverty Under the Age of 16 Correlation Chart
The statistical analysis conducted on geographies consisting of 356,140,791 people shows a moderate positive correlation between the proportion of Hondurans and poverty level among children under the age of 16 in the United States with a correlation coefficient (R) of 0.436 and weighted average of 22.2%. Similarly, the statistical analysis conducted on geographies consisting of 170,217,272 people shows a weak positive correlation between the proportion of Iraqis and poverty level among children under the age of 16 in the United States with a correlation coefficient (R) of 0.242 and weighted average of 17.5%, a difference of 26.5%.
Child Poverty Under the Age of 16 Correlation Summary
| Measurement | Honduran | Iraqi |
| Minimum | 4.4% | 0.44% |
| Maximum | 72.7% | 47.7% |
| Range | 68.3% | 47.3% |
| Mean | 29.2% | 17.2% |
| Median | 26.8% | 15.4% |
| Interquartile 25% (IQ1) | 21.2% | 11.8% |
| Interquartile 75% (IQ3) | 31.5% | 19.2% |
| Interquartile Range (IQR) | 10.4% | 7.4% |
| Standard Deviation (Sample) | 13.7% | 9.3% |
| Standard Deviation (Population) | 13.6% | 9.2% |
Similar Demographics by Child Poverty Under the Age of 16
Demographics Similar to Hondurans by Child Poverty Under the Age of 16
In terms of child poverty under the age of 16, the demographic groups most similar to Hondurans are Kiowa (22.2%, a difference of 0.19%), Cajun (22.1%, a difference of 0.37%), Yakama (22.1%, a difference of 0.58%), Paiute (22.4%, a difference of 1.0%), and U.S. Virgin Islander (22.0%, a difference of 1.1%).
| Demographics | Rating | Rank | Child Poverty Under the Age of 16 |
| Immigrants | Guatemala | 0.0 /100 | #315 | Tragic 21.6% |
| Africans | 0.0 /100 | #316 | Tragic 21.7% |
| Immigrants | Dominica | 0.0 /100 | #317 | Tragic 21.9% |
| U.S. Virgin Islanders | 0.0 /100 | #318 | Tragic 22.0% |
| Yakama | 0.0 /100 | #319 | Tragic 22.1% |
| Cajuns | 0.0 /100 | #320 | Tragic 22.1% |
| Kiowa | 0.0 /100 | #321 | Tragic 22.2% |
| Hondurans | 0.0 /100 | #322 | Tragic 22.2% |
| Paiute | 0.0 /100 | #323 | Tragic 22.4% |
| Central American Indians | 0.0 /100 | #324 | Tragic 22.5% |
| Immigrants | Congo | 0.0 /100 | #325 | Tragic 22.5% |
| Immigrants | Honduras | 0.0 /100 | #326 | Tragic 22.7% |
| Menominee | 0.0 /100 | #327 | Tragic 23.0% |
| Colville | 0.0 /100 | #328 | Tragic 23.0% |
| Dominicans | 0.0 /100 | #329 | Tragic 23.8% |
Demographics Similar to Iraqis by Child Poverty Under the Age of 16
In terms of child poverty under the age of 16, the demographic groups most similar to Iraqis are Malaysian (17.5%, a difference of 0.020%), Immigrants from the Azores (17.5%, a difference of 0.12%), Sierra Leonean (17.6%, a difference of 0.13%), Immigrants (17.5%, a difference of 0.29%), and Immigrants from Thailand (17.5%, a difference of 0.31%).
| Demographics | Rating | Rank | Child Poverty Under the Age of 16 |
| German Russians | 8.6 /100 | #207 | Tragic 17.4% |
| Pennsylvania Germans | 7.5 /100 | #208 | Tragic 17.4% |
| Panamanians | 6.9 /100 | #209 | Tragic 17.5% |
| Alaskan Athabascans | 6.9 /100 | #210 | Tragic 17.5% |
| Immigrants | Thailand | 6.6 /100 | #211 | Tragic 17.5% |
| Immigrants | Immigrants | 6.5 /100 | #212 | Tragic 17.5% |
| Immigrants | Azores | 6.2 /100 | #213 | Tragic 17.5% |
| Iraqis | 5.9 /100 | #214 | Tragic 17.5% |
| Malaysians | 5.9 /100 | #215 | Tragic 17.5% |
| Sierra Leoneans | 5.7 /100 | #216 | Tragic 17.6% |
| Immigrants | Eastern Africa | 5.3 /100 | #217 | Tragic 17.6% |
| Moroccans | 5.3 /100 | #218 | Tragic 17.6% |
| Japanese | 4.7 /100 | #219 | Tragic 17.7% |
| Immigrants | Panama | 4.1 /100 | #220 | Tragic 17.7% |
| Cubans | 3.7 /100 | #221 | Tragic 17.8% |