Honduran vs Indian (Asian) Female Poverty
COMPARE
Honduran
Indian (Asian)
Female Poverty
Female Poverty Comparison
Hondurans
Indians (Asian)
17.4%
FEMALE POVERTY
0.0/ 100
METRIC RATING
316th/ 347
METRIC RANK
12.2%
FEMALE POVERTY
97.9/ 100
METRIC RATING
65th/ 347
METRIC RANK
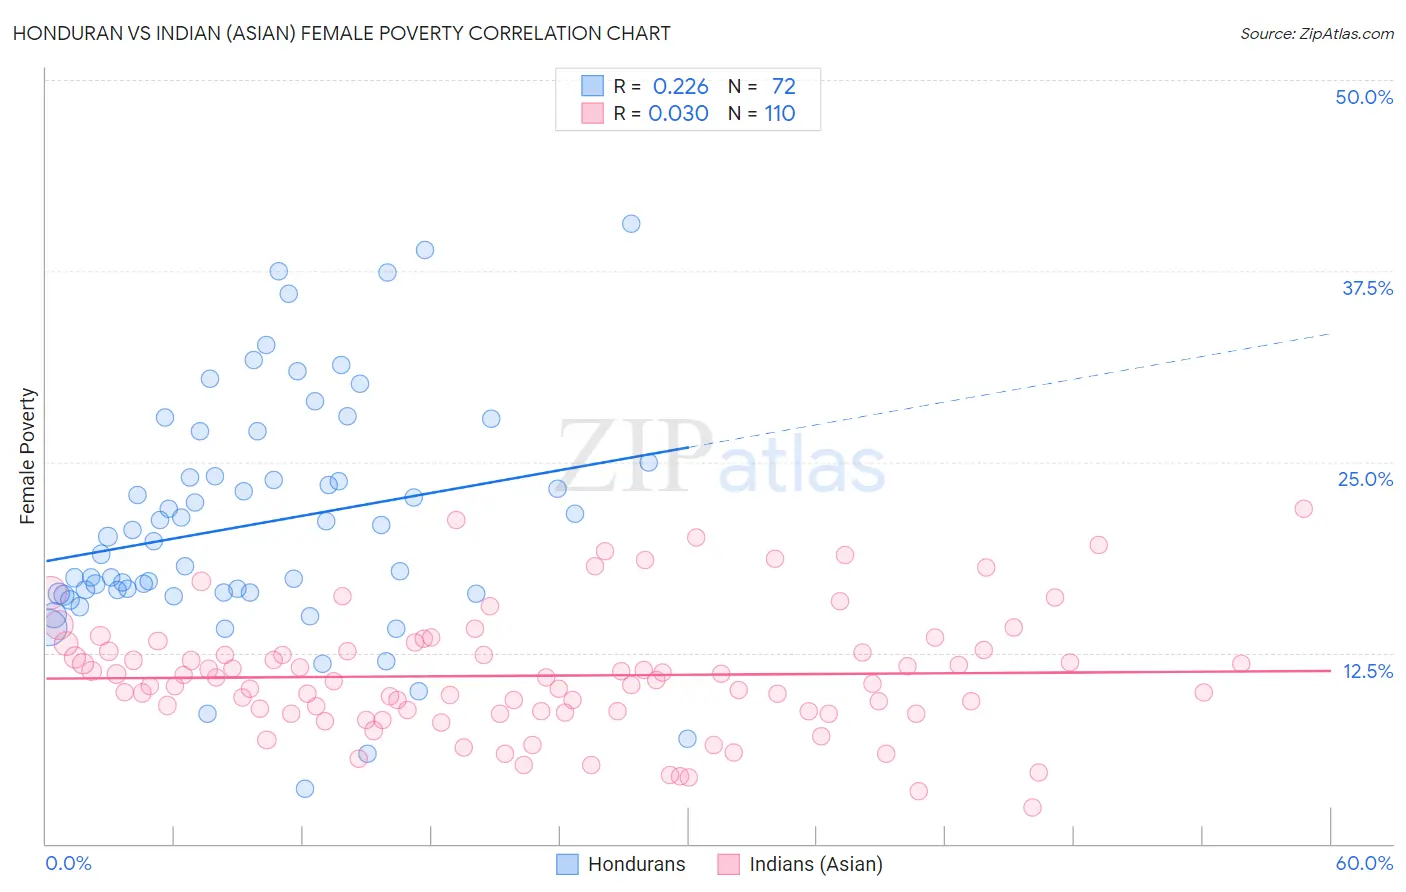
Honduran vs Indian (Asian) Female Poverty Correlation Chart
The statistical analysis conducted on geographies consisting of 357,544,045 people shows a weak positive correlation between the proportion of Hondurans and poverty level among females in the United States with a correlation coefficient (R) of 0.226 and weighted average of 17.4%. Similarly, the statistical analysis conducted on geographies consisting of 494,574,283 people shows no correlation between the proportion of Indians (Asian) and poverty level among females in the United States with a correlation coefficient (R) of 0.030 and weighted average of 12.2%, a difference of 42.4%.
Female Poverty Correlation Summary
| Measurement | Honduran | Indian (Asian) |
| Minimum | 3.6% | 2.4% |
| Maximum | 40.6% | 21.9% |
| Range | 37.0% | 19.5% |
| Mean | 21.0% | 11.0% |
| Median | 20.0% | 10.7% |
| Interquartile 25% (IQ1) | 16.4% | 8.7% |
| Interquartile 75% (IQ3) | 24.5% | 12.6% |
| Interquartile Range (IQR) | 8.1% | 3.9% |
| Standard Deviation (Sample) | 7.7% | 3.9% |
| Standard Deviation (Population) | 7.7% | 3.9% |
Similar Demographics by Female Poverty
Demographics Similar to Hondurans by Female Poverty
In terms of female poverty, the demographic groups most similar to Hondurans are Immigrants from Congo (17.4%, a difference of 0.19%), U.S. Virgin Islander (17.3%, a difference of 0.30%), Ute (17.5%, a difference of 0.52%), Cajun (17.5%, a difference of 0.53%), and Immigrants from Dominica (17.5%, a difference of 0.61%).
| Demographics | Rating | Rank | Female Poverty |
| Immigrants | Mexico | 0.0 /100 | #309 | Tragic 17.0% |
| Creek | 0.0 /100 | #310 | Tragic 17.0% |
| Immigrants | Guatemala | 0.0 /100 | #311 | Tragic 17.0% |
| Immigrants | Somalia | 0.0 /100 | #312 | Tragic 17.0% |
| British West Indians | 0.0 /100 | #313 | Tragic 17.0% |
| Dutch West Indians | 0.0 /100 | #314 | Tragic 17.1% |
| U.S. Virgin Islanders | 0.0 /100 | #315 | Tragic 17.3% |
| Hondurans | 0.0 /100 | #316 | Tragic 17.4% |
| Immigrants | Congo | 0.0 /100 | #317 | Tragic 17.4% |
| Ute | 0.0 /100 | #318 | Tragic 17.5% |
| Cajuns | 0.0 /100 | #319 | Tragic 17.5% |
| Immigrants | Dominica | 0.0 /100 | #320 | Tragic 17.5% |
| Arapaho | 0.0 /100 | #321 | Tragic 17.5% |
| Menominee | 0.0 /100 | #322 | Tragic 17.6% |
| Paiute | 0.0 /100 | #323 | Tragic 17.7% |
Demographics Similar to Indians (Asian) by Female Poverty
In terms of female poverty, the demographic groups most similar to Indians (Asian) are Austrian (12.2%, a difference of 0.010%), German (12.2%, a difference of 0.030%), Ukrainian (12.2%, a difference of 0.060%), Immigrants from Italy (12.2%, a difference of 0.14%), and Immigrants from Eastern Asia (12.2%, a difference of 0.14%).
| Demographics | Rating | Rank | Female Poverty |
| Scandinavians | 98.2 /100 | #58 | Exceptional 12.1% |
| Immigrants | Europe | 98.2 /100 | #59 | Exceptional 12.1% |
| Immigrants | Australia | 98.1 /100 | #60 | Exceptional 12.2% |
| Immigrants | Asia | 98.1 /100 | #61 | Exceptional 12.2% |
| Immigrants | Italy | 98.0 /100 | #62 | Exceptional 12.2% |
| Ukrainians | 98.0 /100 | #63 | Exceptional 12.2% |
| Germans | 98.0 /100 | #64 | Exceptional 12.2% |
| Indians (Asian) | 97.9 /100 | #65 | Exceptional 12.2% |
| Austrians | 97.9 /100 | #66 | Exceptional 12.2% |
| Immigrants | Eastern Asia | 97.8 /100 | #67 | Exceptional 12.2% |
| Immigrants | Netherlands | 97.8 /100 | #68 | Exceptional 12.2% |
| Swiss | 97.7 /100 | #69 | Exceptional 12.2% |
| Immigrants | Belgium | 97.7 /100 | #70 | Exceptional 12.2% |
| Carpatho Rusyns | 97.6 /100 | #71 | Exceptional 12.2% |
| Cambodians | 97.5 /100 | #72 | Exceptional 12.2% |