Honduran vs Immigrants from Caribbean Single Mother Poverty
COMPARE
Honduran
Immigrants from Caribbean
Single Mother Poverty
Single Mother Poverty Comparison
Hondurans
Immigrants from Caribbean
34.2%
SINGLE MOTHER POVERTY
0.0/ 100
METRIC RATING
310th/ 347
METRIC RANK
31.1%
SINGLE MOTHER POVERTY
0.4/ 100
METRIC RATING
258th/ 347
METRIC RANK
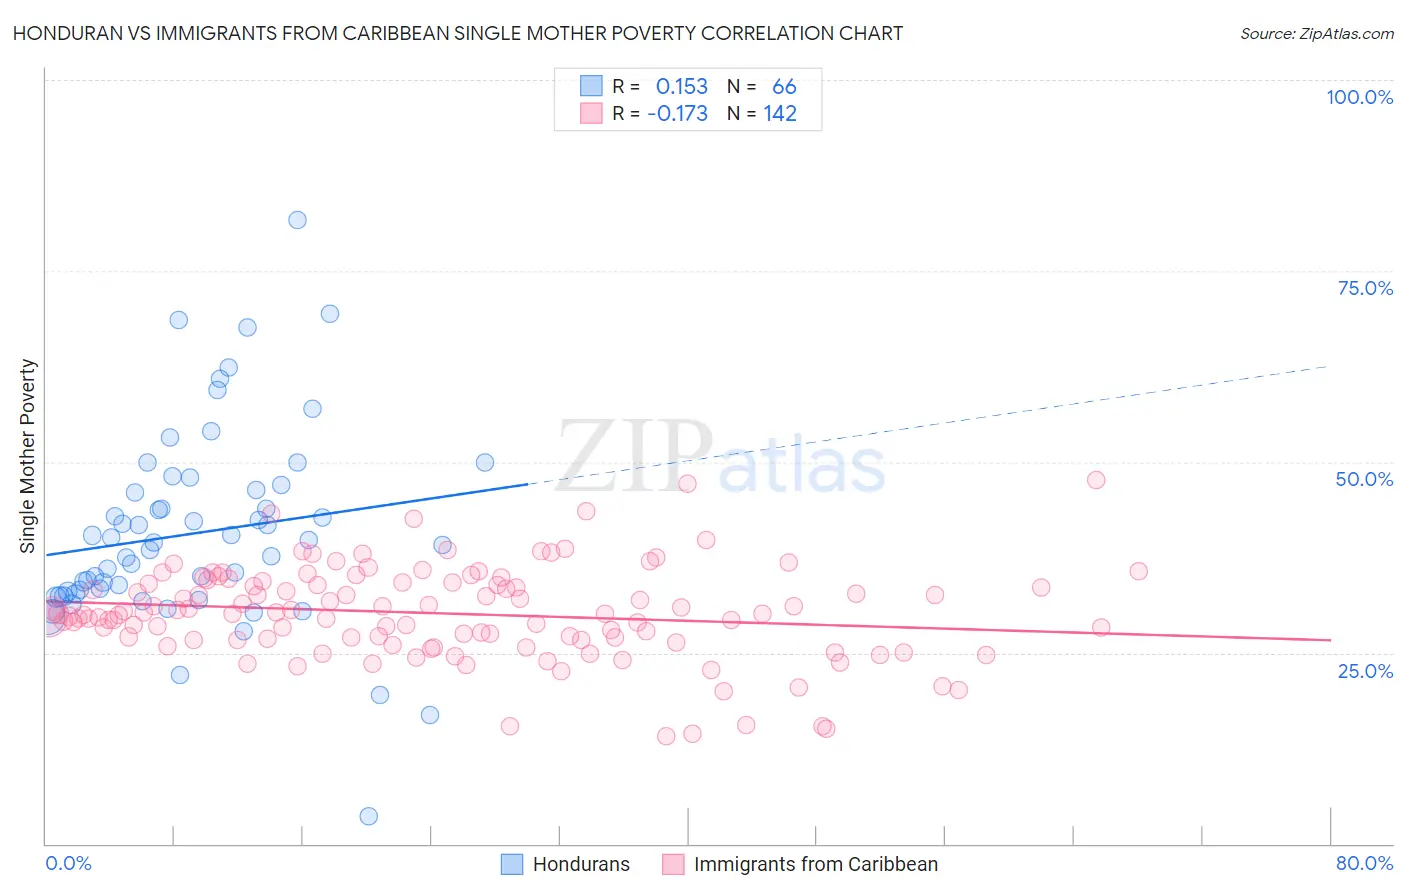
Honduran vs Immigrants from Caribbean Single Mother Poverty Correlation Chart
The statistical analysis conducted on geographies consisting of 352,983,929 people shows a poor positive correlation between the proportion of Hondurans and poverty level among single mothers in the United States with a correlation coefficient (R) of 0.153 and weighted average of 34.2%. Similarly, the statistical analysis conducted on geographies consisting of 437,361,394 people shows a poor negative correlation between the proportion of Immigrants from Caribbean and poverty level among single mothers in the United States with a correlation coefficient (R) of -0.173 and weighted average of 31.1%, a difference of 9.9%.
Single Mother Poverty Correlation Summary
| Measurement | Honduran | Immigrants from Caribbean |
| Minimum | 3.6% | 14.1% |
| Maximum | 81.7% | 47.6% |
| Range | 78.2% | 33.5% |
| Mean | 40.6% | 30.2% |
| Median | 39.2% | 30.1% |
| Interquartile 25% (IQ1) | 32.8% | 26.7% |
| Interquartile 75% (IQ3) | 46.3% | 34.2% |
| Interquartile Range (IQR) | 13.5% | 7.4% |
| Standard Deviation (Sample) | 12.9% | 6.1% |
| Standard Deviation (Population) | 12.8% | 6.0% |
Similar Demographics by Single Mother Poverty
Demographics Similar to Hondurans by Single Mother Poverty
In terms of single mother poverty, the demographic groups most similar to Hondurans are Potawatomi (34.1%, a difference of 0.22%), Alsatian (34.3%, a difference of 0.31%), Central American Indian (34.3%, a difference of 0.39%), Immigrants from Dominican Republic (34.4%, a difference of 0.47%), and Immigrants from Mexico (34.0%, a difference of 0.64%).
| Demographics | Rating | Rank | Single Mother Poverty |
| Americans | 0.0 /100 | #303 | Tragic 33.5% |
| Mexicans | 0.0 /100 | #304 | Tragic 33.6% |
| Immigrants | Central America | 0.0 /100 | #305 | Tragic 33.6% |
| Immigrants | Congo | 0.0 /100 | #306 | Tragic 33.8% |
| Comanche | 0.0 /100 | #307 | Tragic 33.9% |
| Immigrants | Mexico | 0.0 /100 | #308 | Tragic 34.0% |
| Potawatomi | 0.0 /100 | #309 | Tragic 34.1% |
| Hondurans | 0.0 /100 | #310 | Tragic 34.2% |
| Alsatians | 0.0 /100 | #311 | Tragic 34.3% |
| Central American Indians | 0.0 /100 | #312 | Tragic 34.3% |
| Immigrants | Dominican Republic | 0.0 /100 | #313 | Tragic 34.4% |
| Chickasaw | 0.0 /100 | #314 | Tragic 34.4% |
| Hopi | 0.0 /100 | #315 | Tragic 34.5% |
| Dominicans | 0.0 /100 | #316 | Tragic 34.5% |
| Cherokee | 0.0 /100 | #317 | Tragic 34.5% |
Demographics Similar to Immigrants from Caribbean by Single Mother Poverty
In terms of single mother poverty, the demographic groups most similar to Immigrants from Caribbean are Immigrants from Bangladesh (31.1%, a difference of 0.030%), Immigrants from Bahamas (31.1%, a difference of 0.090%), Immigrants from West Indies (31.1%, a difference of 0.13%), White/Caucasian (31.2%, a difference of 0.19%), and Immigrants from El Salvador (31.2%, a difference of 0.27%).
| Demographics | Rating | Rank | Single Mother Poverty |
| Tlingit-Haida | 0.6 /100 | #251 | Tragic 30.9% |
| Alaska Natives | 0.6 /100 | #252 | Tragic 30.9% |
| Celtics | 0.6 /100 | #253 | Tragic 30.9% |
| Senegalese | 0.5 /100 | #254 | Tragic 31.0% |
| Belizeans | 0.5 /100 | #255 | Tragic 31.0% |
| Immigrants | West Indies | 0.4 /100 | #256 | Tragic 31.1% |
| Immigrants | Bahamas | 0.4 /100 | #257 | Tragic 31.1% |
| Immigrants | Caribbean | 0.4 /100 | #258 | Tragic 31.1% |
| Immigrants | Bangladesh | 0.4 /100 | #259 | Tragic 31.1% |
| Whites/Caucasians | 0.3 /100 | #260 | Tragic 31.2% |
| Immigrants | El Salvador | 0.3 /100 | #261 | Tragic 31.2% |
| Hmong | 0.3 /100 | #262 | Tragic 31.2% |
| Bahamians | 0.2 /100 | #263 | Tragic 31.3% |
| Immigrants | Ecuador | 0.2 /100 | #264 | Tragic 31.3% |
| German Russians | 0.2 /100 | #265 | Tragic 31.3% |