Honduran vs Cree Child Poverty Under the Age of 5
COMPARE
Honduran
Cree
Child Poverty Under the Age of 5
Child Poverty Under the Age of 5 Comparison
Hondurans
Cree
23.0%
CHILD POVERTY UNDER THE AGE OF 5
0.0/ 100
METRIC RATING
312th/ 347
METRIC RANK
19.7%
CHILD POVERTY UNDER THE AGE OF 5
0.4/ 100
METRIC RATING
246th/ 347
METRIC RANK
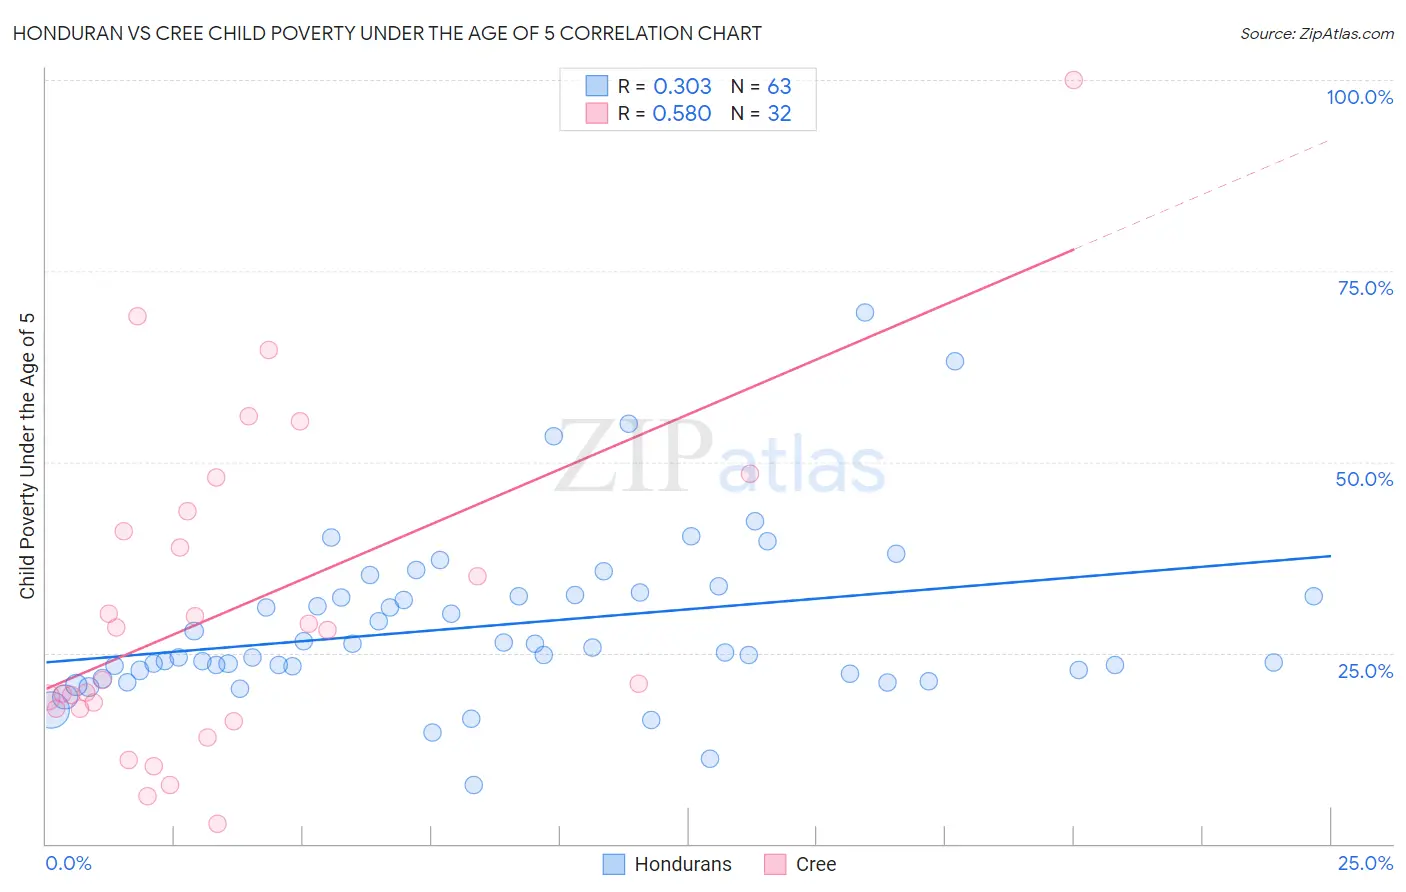
Honduran vs Cree Child Poverty Under the Age of 5 Correlation Chart
The statistical analysis conducted on geographies consisting of 349,714,748 people shows a mild positive correlation between the proportion of Hondurans and poverty level among children under the age of 5 in the United States with a correlation coefficient (R) of 0.303 and weighted average of 23.0%. Similarly, the statistical analysis conducted on geographies consisting of 75,401,042 people shows a substantial positive correlation between the proportion of Cree and poverty level among children under the age of 5 in the United States with a correlation coefficient (R) of 0.580 and weighted average of 19.7%, a difference of 16.6%.
Child Poverty Under the Age of 5 Correlation Summary
| Measurement | Honduran | Cree |
| Minimum | 7.7% | 2.6% |
| Maximum | 69.6% | 100.0% |
| Range | 61.9% | 97.4% |
| Mean | 28.6% | 30.8% |
| Median | 25.0% | 24.7% |
| Interquartile 25% (IQ1) | 22.7% | 17.7% |
| Interquartile 75% (IQ3) | 32.5% | 42.2% |
| Interquartile Range (IQR) | 9.8% | 24.5% |
| Standard Deviation (Sample) | 11.0% | 21.3% |
| Standard Deviation (Population) | 10.9% | 20.9% |
Similar Demographics by Child Poverty Under the Age of 5
Demographics Similar to Hondurans by Child Poverty Under the Age of 5
In terms of child poverty under the age of 5, the demographic groups most similar to Hondurans are Bahamian (23.0%, a difference of 0.050%), U.S. Virgin Islander (23.0%, a difference of 0.14%), Seminole (22.8%, a difference of 0.60%), African (22.8%, a difference of 0.64%), and Arapaho (23.1%, a difference of 0.70%).
| Demographics | Rating | Rank | Child Poverty Under the Age of 5 |
| Immigrants | Mexico | 0.0 /100 | #305 | Tragic 22.2% |
| Indonesians | 0.0 /100 | #306 | Tragic 22.3% |
| Immigrants | Bahamas | 0.0 /100 | #307 | Tragic 22.7% |
| Immigrants | Dominica | 0.0 /100 | #308 | Tragic 22.7% |
| Houma | 0.0 /100 | #309 | Tragic 22.7% |
| Africans | 0.0 /100 | #310 | Tragic 22.8% |
| Seminole | 0.0 /100 | #311 | Tragic 22.8% |
| Hondurans | 0.0 /100 | #312 | Tragic 23.0% |
| Bahamians | 0.0 /100 | #313 | Tragic 23.0% |
| U.S. Virgin Islanders | 0.0 /100 | #314 | Tragic 23.0% |
| Arapaho | 0.0 /100 | #315 | Tragic 23.1% |
| Yakama | 0.0 /100 | #316 | Tragic 23.1% |
| Menominee | 0.0 /100 | #317 | Tragic 23.3% |
| Dutch West Indians | 0.0 /100 | #318 | Tragic 23.3% |
| Chippewa | 0.0 /100 | #319 | Tragic 23.4% |
Demographics Similar to Cree by Child Poverty Under the Age of 5
In terms of child poverty under the age of 5, the demographic groups most similar to Cree are Immigrants from Western Africa (19.7%, a difference of 0.070%), Guyanese (19.7%, a difference of 0.16%), Marshallese (19.7%, a difference of 0.17%), Immigrants from Middle Africa (19.7%, a difference of 0.19%), and Nonimmigrants (19.7%, a difference of 0.24%).
| Demographics | Rating | Rank | Child Poverty Under the Age of 5 |
| Vietnamese | 0.6 /100 | #239 | Tragic 19.5% |
| Immigrants | Ecuador | 0.5 /100 | #240 | Tragic 19.6% |
| Alaska Natives | 0.5 /100 | #241 | Tragic 19.6% |
| Immigrants | Guyana | 0.5 /100 | #242 | Tragic 19.6% |
| Osage | 0.5 /100 | #243 | Tragic 19.6% |
| Immigrants | Ghana | 0.5 /100 | #244 | Tragic 19.6% |
| Immigrants | Western Africa | 0.4 /100 | #245 | Tragic 19.7% |
| Cree | 0.4 /100 | #246 | Tragic 19.7% |
| Guyanese | 0.4 /100 | #247 | Tragic 19.7% |
| Marshallese | 0.4 /100 | #248 | Tragic 19.7% |
| Immigrants | Middle Africa | 0.4 /100 | #249 | Tragic 19.7% |
| Immigrants | Nonimmigrants | 0.4 /100 | #250 | Tragic 19.7% |
| Pennsylvania Germans | 0.3 /100 | #251 | Tragic 19.8% |
| Immigrants | Nicaragua | 0.3 /100 | #252 | Tragic 19.8% |
| Mexican American Indians | 0.3 /100 | #253 | Tragic 19.9% |