Hmong vs Slovene Seniors Poverty Over the Age of 75
COMPARE
Hmong
Slovene
Seniors Poverty Over the Age of 75
Seniors Poverty Over the Age of 75 Comparison
Hmong
Slovenes
12.0%
SENIORS POVERTY OVER THE AGE OF 75
70.8/ 100
METRIC RATING
144th/ 347
METRIC RANK
10.6%
SENIORS POVERTY OVER THE AGE OF 75
99.9/ 100
METRIC RATING
21st/ 347
METRIC RANK
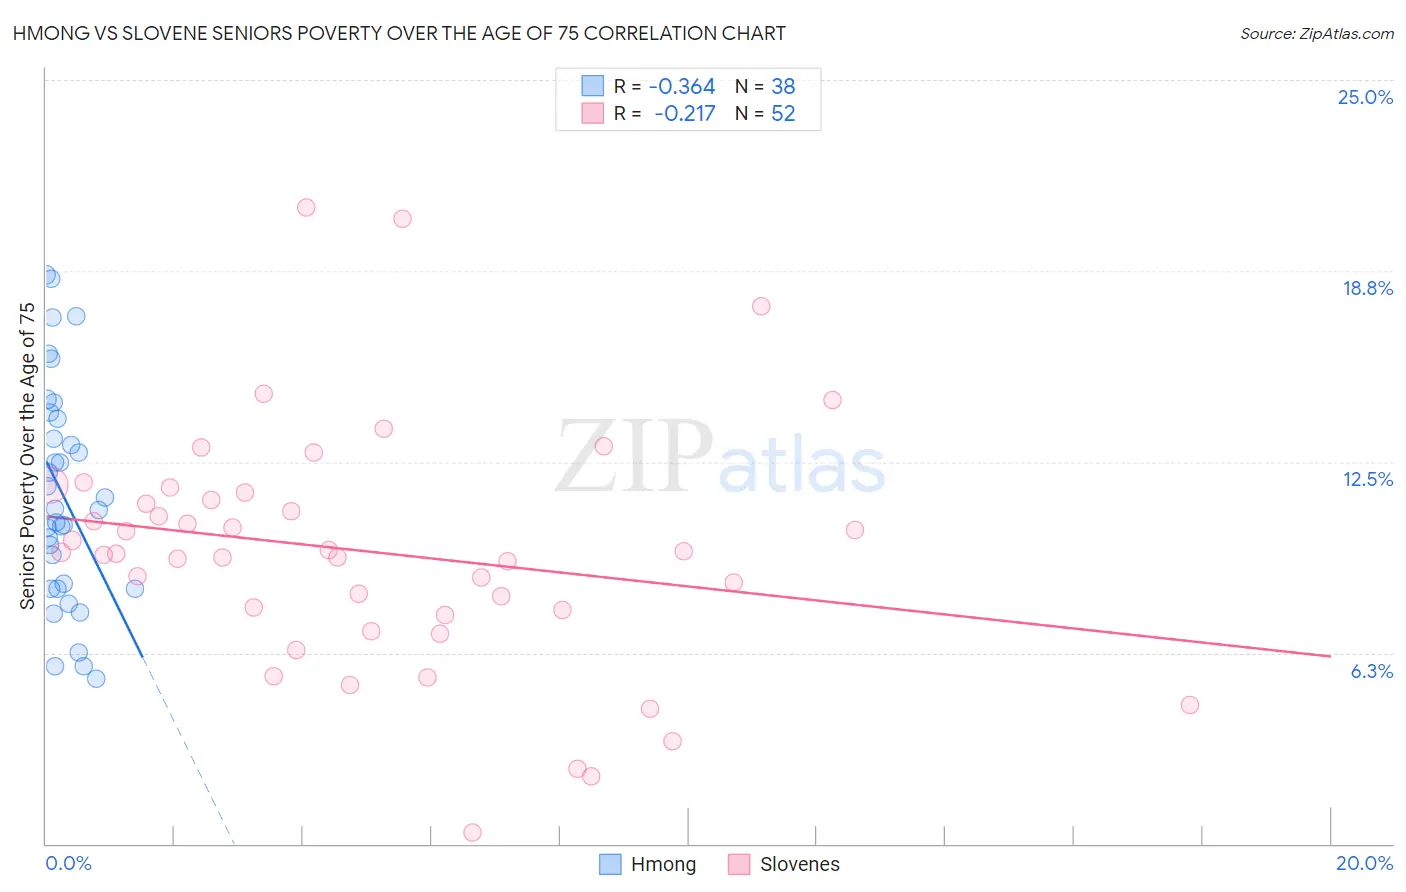
Hmong vs Slovene Seniors Poverty Over the Age of 75 Correlation Chart
The statistical analysis conducted on geographies consisting of 24,651,884 people shows a mild negative correlation between the proportion of Hmong and poverty level among seniors over the age of 75 in the United States with a correlation coefficient (R) of -0.364 and weighted average of 12.0%. Similarly, the statistical analysis conducted on geographies consisting of 259,031,595 people shows a weak negative correlation between the proportion of Slovenes and poverty level among seniors over the age of 75 in the United States with a correlation coefficient (R) of -0.217 and weighted average of 10.6%, a difference of 13.4%.
Seniors Poverty Over the Age of 75 Correlation Summary
| Measurement | Hmong | Slovene |
| Minimum | 5.4% | 0.36% |
| Maximum | 18.6% | 20.8% |
| Range | 13.2% | 20.5% |
| Mean | 11.4% | 9.6% |
| Median | 10.9% | 9.5% |
| Interquartile 25% (IQ1) | 8.4% | 7.6% |
| Interquartile 75% (IQ3) | 13.9% | 11.4% |
| Interquartile Range (IQR) | 5.6% | 3.8% |
| Standard Deviation (Sample) | 3.6% | 4.0% |
| Standard Deviation (Population) | 3.5% | 4.0% |
Similar Demographics by Seniors Poverty Over the Age of 75
Demographics Similar to Hmong by Seniors Poverty Over the Age of 75
In terms of seniors poverty over the age of 75, the demographic groups most similar to Hmong are Immigrants from Belgium (12.0%, a difference of 0.0%), American (12.0%, a difference of 0.010%), Bangladeshi (12.0%, a difference of 0.050%), Immigrants from Laos (12.0%, a difference of 0.060%), and Immigrants from Cameroon (12.0%, a difference of 0.090%).
| Demographics | Rating | Rank | Seniors Poverty Over the Age of 75 |
| Immigrants | Moldova | 74.1 /100 | #137 | Good 11.9% |
| Immigrants | Romania | 72.6 /100 | #138 | Good 11.9% |
| Immigrants | Kenya | 72.6 /100 | #139 | Good 11.9% |
| Immigrants | Pakistan | 71.9 /100 | #140 | Good 12.0% |
| Immigrants | Cameroon | 71.7 /100 | #141 | Good 12.0% |
| Immigrants | Laos | 71.5 /100 | #142 | Good 12.0% |
| Americans | 71.0 /100 | #143 | Good 12.0% |
| Hmong | 70.8 /100 | #144 | Good 12.0% |
| Immigrants | Belgium | 70.8 /100 | #145 | Good 12.0% |
| Bangladeshis | 70.4 /100 | #146 | Good 12.0% |
| Immigrants | Latvia | 69.1 /100 | #147 | Good 12.0% |
| Immigrants | Zaire | 67.6 /100 | #148 | Good 12.0% |
| Asians | 67.4 /100 | #149 | Good 12.0% |
| Cypriots | 67.3 /100 | #150 | Good 12.0% |
| Cherokee | 65.8 /100 | #151 | Good 12.0% |
Demographics Similar to Slovenes by Seniors Poverty Over the Age of 75
In terms of seniors poverty over the age of 75, the demographic groups most similar to Slovenes are Czech (10.5%, a difference of 0.040%), Immigrants from Scotland (10.5%, a difference of 0.060%), Welsh (10.5%, a difference of 0.090%), Slovak (10.5%, a difference of 0.10%), and Bhutanese (10.6%, a difference of 0.26%).
| Demographics | Rating | Rank | Seniors Poverty Over the Age of 75 |
| Scottish | 99.9 /100 | #14 | Exceptional 10.5% |
| Europeans | 99.9 /100 | #15 | Exceptional 10.5% |
| Dutch | 99.9 /100 | #16 | Exceptional 10.5% |
| Slovaks | 99.9 /100 | #17 | Exceptional 10.5% |
| Welsh | 99.9 /100 | #18 | Exceptional 10.5% |
| Immigrants | Scotland | 99.9 /100 | #19 | Exceptional 10.5% |
| Czechs | 99.9 /100 | #20 | Exceptional 10.5% |
| Slovenes | 99.9 /100 | #21 | Exceptional 10.6% |
| Bhutanese | 99.8 /100 | #22 | Exceptional 10.6% |
| Lithuanians | 99.8 /100 | #23 | Exceptional 10.6% |
| Poles | 99.8 /100 | #24 | Exceptional 10.6% |
| Menominee | 99.8 /100 | #25 | Exceptional 10.6% |
| Bulgarians | 99.8 /100 | #26 | Exceptional 10.7% |
| Northern Europeans | 99.8 /100 | #27 | Exceptional 10.7% |
| Irish | 99.8 /100 | #28 | Exceptional 10.7% |