Hmong vs Immigrants from Nicaragua Seniors Poverty Over the Age of 65
COMPARE
Hmong
Immigrants from Nicaragua
Seniors Poverty Over the Age of 65
Seniors Poverty Over the Age of 65 Comparison
Hmong
Immigrants from Nicaragua
10.4%
SENIORS POVERTY OVER THE AGE OF 65
90.0/ 100
METRIC RATING
123rd/ 347
METRIC RANK
15.9%
SENIORS POVERTY OVER THE AGE OF 65
0.0/ 100
METRIC RATING
334th/ 347
METRIC RANK
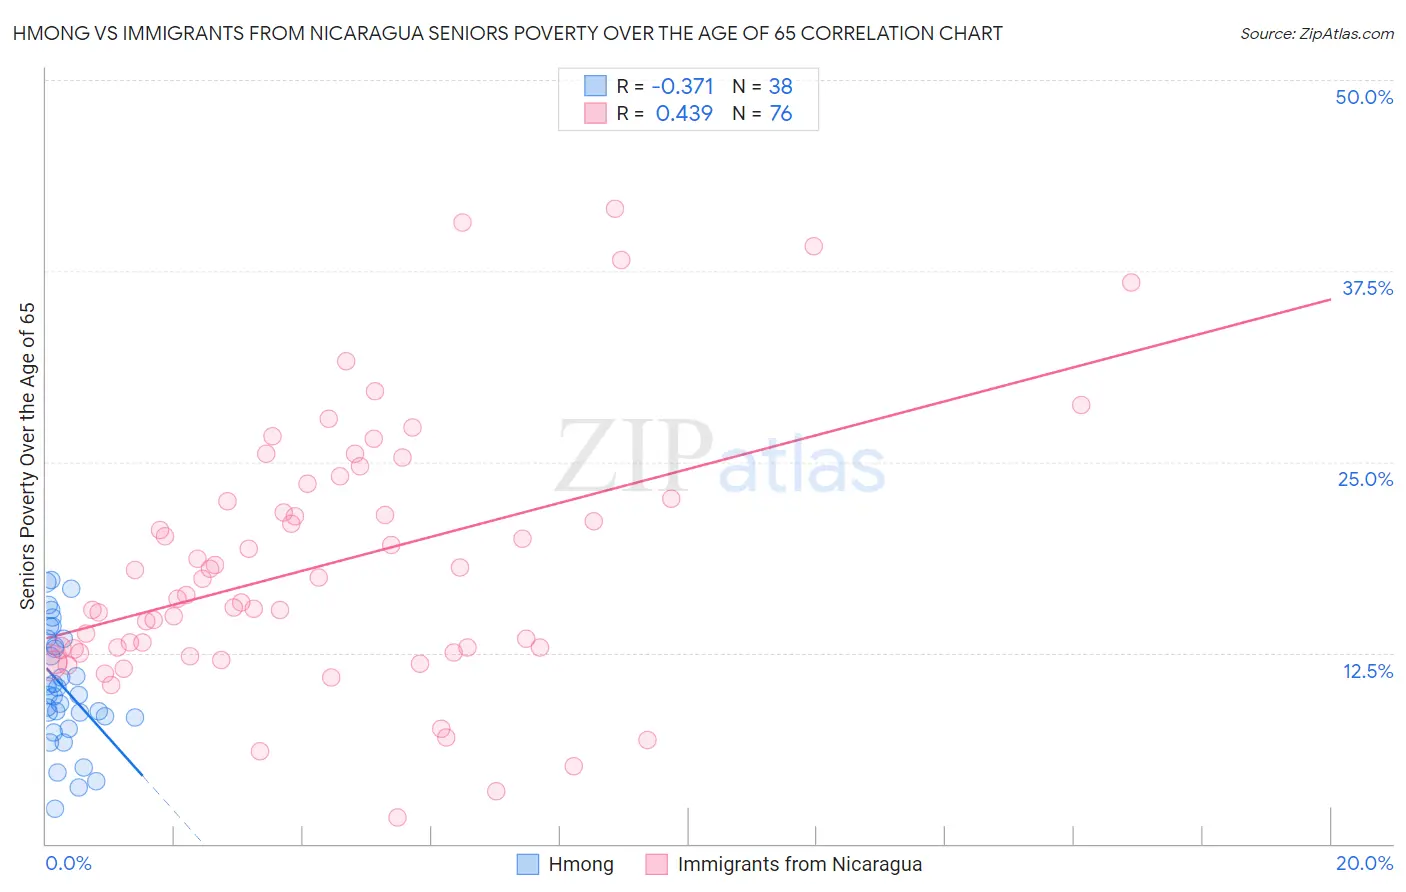
Hmong vs Immigrants from Nicaragua Seniors Poverty Over the Age of 65 Correlation Chart
The statistical analysis conducted on geographies consisting of 24,669,739 people shows a mild negative correlation between the proportion of Hmong and poverty level among seniors over the age of 65 in the United States with a correlation coefficient (R) of -0.371 and weighted average of 10.4%. Similarly, the statistical analysis conducted on geographies consisting of 236,090,448 people shows a moderate positive correlation between the proportion of Immigrants from Nicaragua and poverty level among seniors over the age of 65 in the United States with a correlation coefficient (R) of 0.439 and weighted average of 15.9%, a difference of 52.9%.
Seniors Poverty Over the Age of 65 Correlation Summary
| Measurement | Hmong | Immigrants from Nicaragua |
| Minimum | 2.3% | 1.7% |
| Maximum | 17.3% | 41.6% |
| Range | 15.0% | 39.9% |
| Mean | 10.2% | 18.2% |
| Median | 9.7% | 16.2% |
| Interquartile 25% (IQ1) | 8.2% | 12.6% |
| Interquartile 75% (IQ3) | 13.4% | 22.5% |
| Interquartile Range (IQR) | 5.2% | 9.9% |
| Standard Deviation (Sample) | 3.9% | 8.5% |
| Standard Deviation (Population) | 3.8% | 8.4% |
Similar Demographics by Seniors Poverty Over the Age of 65
Demographics Similar to Hmong by Seniors Poverty Over the Age of 65
In terms of seniors poverty over the age of 65, the demographic groups most similar to Hmong are Asian (10.4%, a difference of 0.030%), Immigrants from Philippines (10.4%, a difference of 0.17%), Immigrants from Iraq (10.4%, a difference of 0.18%), Immigrants from Moldova (10.4%, a difference of 0.18%), and Immigrants from Bosnia and Herzegovina (10.4%, a difference of 0.22%).
| Demographics | Rating | Rank | Seniors Poverty Over the Age of 65 |
| Pakistanis | 92.2 /100 | #116 | Exceptional 10.3% |
| Lebanese | 92.0 /100 | #117 | Exceptional 10.3% |
| Okinawans | 91.7 /100 | #118 | Exceptional 10.4% |
| Immigrants | Western Europe | 91.1 /100 | #119 | Exceptional 10.4% |
| Immigrants | Bosnia and Herzegovina | 90.8 /100 | #120 | Exceptional 10.4% |
| Immigrants | Iraq | 90.7 /100 | #121 | Exceptional 10.4% |
| Immigrants | Moldova | 90.7 /100 | #122 | Exceptional 10.4% |
| Hmong | 90.0 /100 | #123 | Exceptional 10.4% |
| Asians | 89.9 /100 | #124 | Excellent 10.4% |
| Immigrants | Philippines | 89.4 /100 | #125 | Excellent 10.4% |
| Immigrants | Hungary | 89.1 /100 | #126 | Excellent 10.4% |
| Cambodians | 89.1 /100 | #127 | Excellent 10.4% |
| Ottawa | 88.5 /100 | #128 | Excellent 10.4% |
| Immigrants | Iran | 88.4 /100 | #129 | Excellent 10.4% |
| Immigrants | Oceania | 88.4 /100 | #130 | Excellent 10.4% |
Demographics Similar to Immigrants from Nicaragua by Seniors Poverty Over the Age of 65
In terms of seniors poverty over the age of 65, the demographic groups most similar to Immigrants from Nicaragua are Immigrants from Yemen (15.9%, a difference of 0.15%), Immigrants from Grenada (15.8%, a difference of 0.58%), Cuban (16.1%, a difference of 1.3%), Immigrants from Cabo Verde (16.2%, a difference of 1.8%), and British West Indian (15.6%, a difference of 2.0%).
| Demographics | Rating | Rank | Seniors Poverty Over the Age of 65 |
| Crow | 0.0 /100 | #327 | Tragic 15.2% |
| Sioux | 0.0 /100 | #328 | Tragic 15.3% |
| Immigrants | Dominica | 0.0 /100 | #329 | Tragic 15.5% |
| Immigrants | St. Vincent and the Grenadines | 0.0 /100 | #330 | Tragic 15.5% |
| British West Indians | 0.0 /100 | #331 | Tragic 15.6% |
| Immigrants | Grenada | 0.0 /100 | #332 | Tragic 15.8% |
| Immigrants | Yemen | 0.0 /100 | #333 | Tragic 15.9% |
| Immigrants | Nicaragua | 0.0 /100 | #334 | Tragic 15.9% |
| Cubans | 0.0 /100 | #335 | Tragic 16.1% |
| Immigrants | Cabo Verde | 0.0 /100 | #336 | Tragic 16.2% |
| Immigrants | Caribbean | 0.0 /100 | #337 | Tragic 16.5% |
| Pueblo | 0.0 /100 | #338 | Tragic 17.2% |
| Navajo | 0.0 /100 | #339 | Tragic 17.5% |
| Hopi | 0.0 /100 | #340 | Tragic 17.8% |
| Dominicans | 0.0 /100 | #341 | Tragic 17.8% |