Hispanic or Latino vs West Indian Female Poverty
COMPARE
Hispanic or Latino
West Indian
Female Poverty
Female Poverty Comparison
Hispanics or Latinos
West Indians
16.6%
FEMALE POVERTY
0.0/ 100
METRIC RATING
299th/ 347
METRIC RANK
16.1%
FEMALE POVERTY
0.0/ 100
METRIC RATING
281st/ 347
METRIC RANK
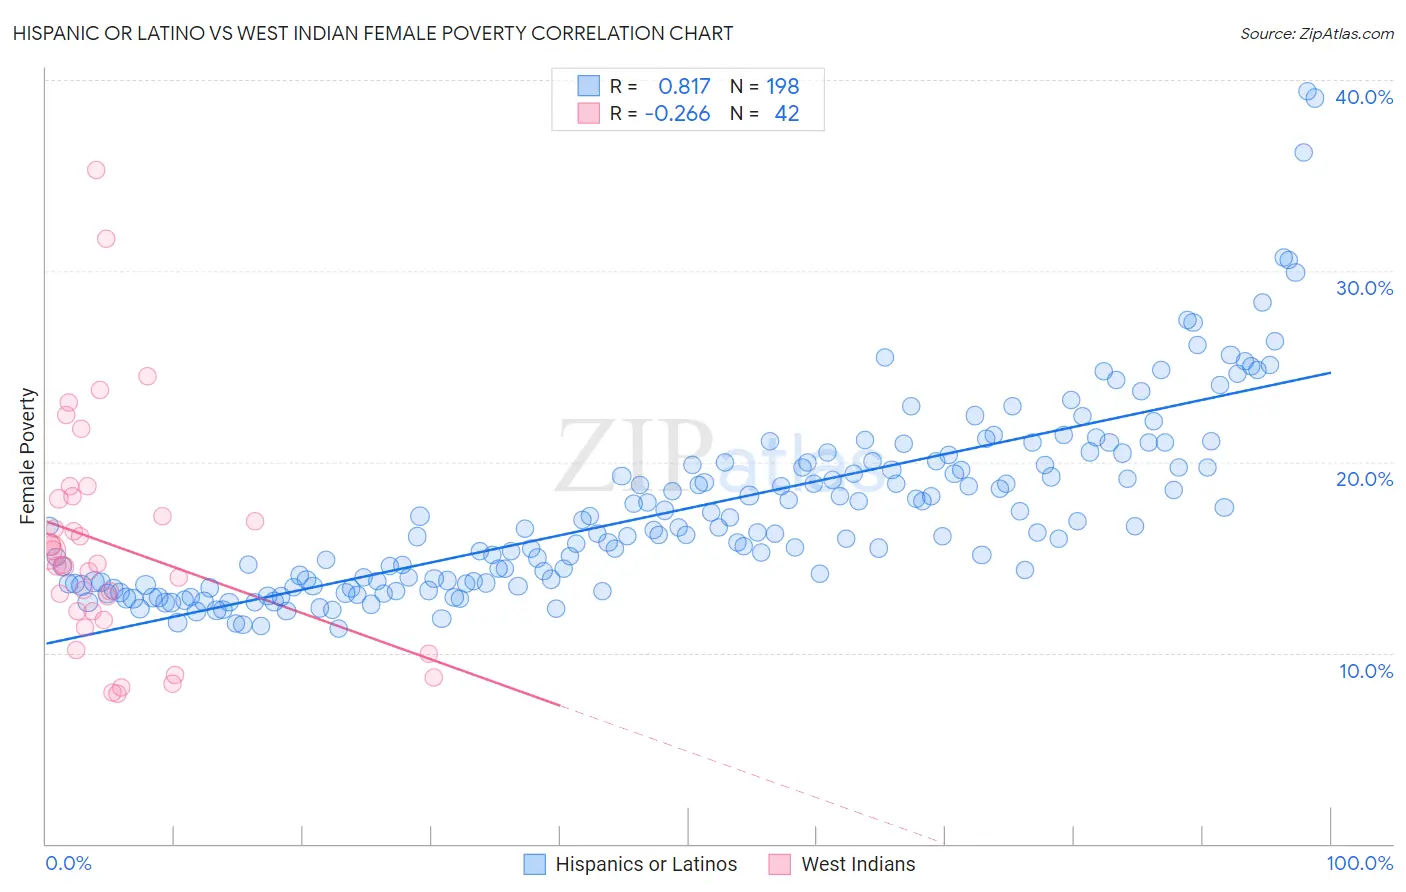
Hispanic or Latino vs West Indian Female Poverty Correlation Chart
The statistical analysis conducted on geographies consisting of 574,030,648 people shows a very strong positive correlation between the proportion of Hispanics or Latinos and poverty level among females in the United States with a correlation coefficient (R) of 0.817 and weighted average of 16.6%. Similarly, the statistical analysis conducted on geographies consisting of 253,850,168 people shows a weak negative correlation between the proportion of West Indians and poverty level among females in the United States with a correlation coefficient (R) of -0.266 and weighted average of 16.1%, a difference of 3.3%.
Female Poverty Correlation Summary
| Measurement | Hispanic or Latino | West Indian |
| Minimum | 11.3% | 7.8% |
| Maximum | 39.4% | 35.3% |
| Range | 28.1% | 27.4% |
| Mean | 17.5% | 15.7% |
| Median | 16.3% | 14.6% |
| Interquartile 25% (IQ1) | 13.6% | 12.2% |
| Interquartile 75% (IQ3) | 19.8% | 18.1% |
| Interquartile Range (IQR) | 6.2% | 5.9% |
| Standard Deviation (Sample) | 5.0% | 5.9% |
| Standard Deviation (Population) | 5.0% | 5.9% |
Demographics Similar to Hispanics or Latinos and West Indians by Female Poverty
In terms of female poverty, the demographic groups most similar to Hispanics or Latinos are Bahamian (16.6%, a difference of 0.040%), Somali (16.6%, a difference of 0.52%), Mexican (16.5%, a difference of 0.73%), Immigrants from Senegal (16.5%, a difference of 1.1%), and Senegalese (16.5%, a difference of 1.1%). Similarly, the demographic groups most similar to West Indians are Vietnamese (16.1%, a difference of 0.020%), Immigrants from Haiti (16.1%, a difference of 0.15%), Immigrants from Cuba (16.1%, a difference of 0.24%), Spanish American (16.2%, a difference of 0.29%), and Comanche (16.2%, a difference of 0.36%).
| Demographics | Rating | Rank | Female Poverty |
| Vietnamese | 0.0 /100 | #280 | Tragic 16.1% |
| West Indians | 0.0 /100 | #281 | Tragic 16.1% |
| Immigrants | Haiti | 0.0 /100 | #282 | Tragic 16.1% |
| Immigrants | Cuba | 0.0 /100 | #283 | Tragic 16.1% |
| Spanish Americans | 0.0 /100 | #284 | Tragic 16.2% |
| Comanche | 0.0 /100 | #285 | Tragic 16.2% |
| Inupiat | 0.0 /100 | #286 | Tragic 16.2% |
| Immigrants | Belize | 0.0 /100 | #287 | Tragic 16.3% |
| Indonesians | 0.0 /100 | #288 | Tragic 16.4% |
| Blackfeet | 0.0 /100 | #289 | Tragic 16.4% |
| Immigrants | Bangladesh | 0.0 /100 | #290 | Tragic 16.4% |
| Yaqui | 0.0 /100 | #291 | Tragic 16.4% |
| Immigrants | Zaire | 0.0 /100 | #292 | Tragic 16.4% |
| Immigrants | Latin America | 0.0 /100 | #293 | Tragic 16.4% |
| Immigrants | Cabo Verde | 0.0 /100 | #294 | Tragic 16.4% |
| Senegalese | 0.0 /100 | #295 | Tragic 16.5% |
| Immigrants | Senegal | 0.0 /100 | #296 | Tragic 16.5% |
| Mexicans | 0.0 /100 | #297 | Tragic 16.5% |
| Somalis | 0.0 /100 | #298 | Tragic 16.6% |
| Hispanics or Latinos | 0.0 /100 | #299 | Tragic 16.6% |
| Bahamians | 0.0 /100 | #300 | Tragic 16.6% |