Hispanic or Latino vs Venezuelan Child Poverty Among Boys Under 16
COMPARE
Hispanic or Latino
Venezuelan
Child Poverty Among Boys Under 16
Child Poverty Among Boys Under 16 Comparison
Hispanics or Latinos
Venezuelans
20.9%
CHILD POVERTY AMONG BOYS UNDER 16
0.0/ 100
METRIC RATING
297th/ 347
METRIC RANK
15.7%
CHILD POVERTY AMONG BOYS UNDER 16
82.1/ 100
METRIC RATING
147th/ 347
METRIC RANK
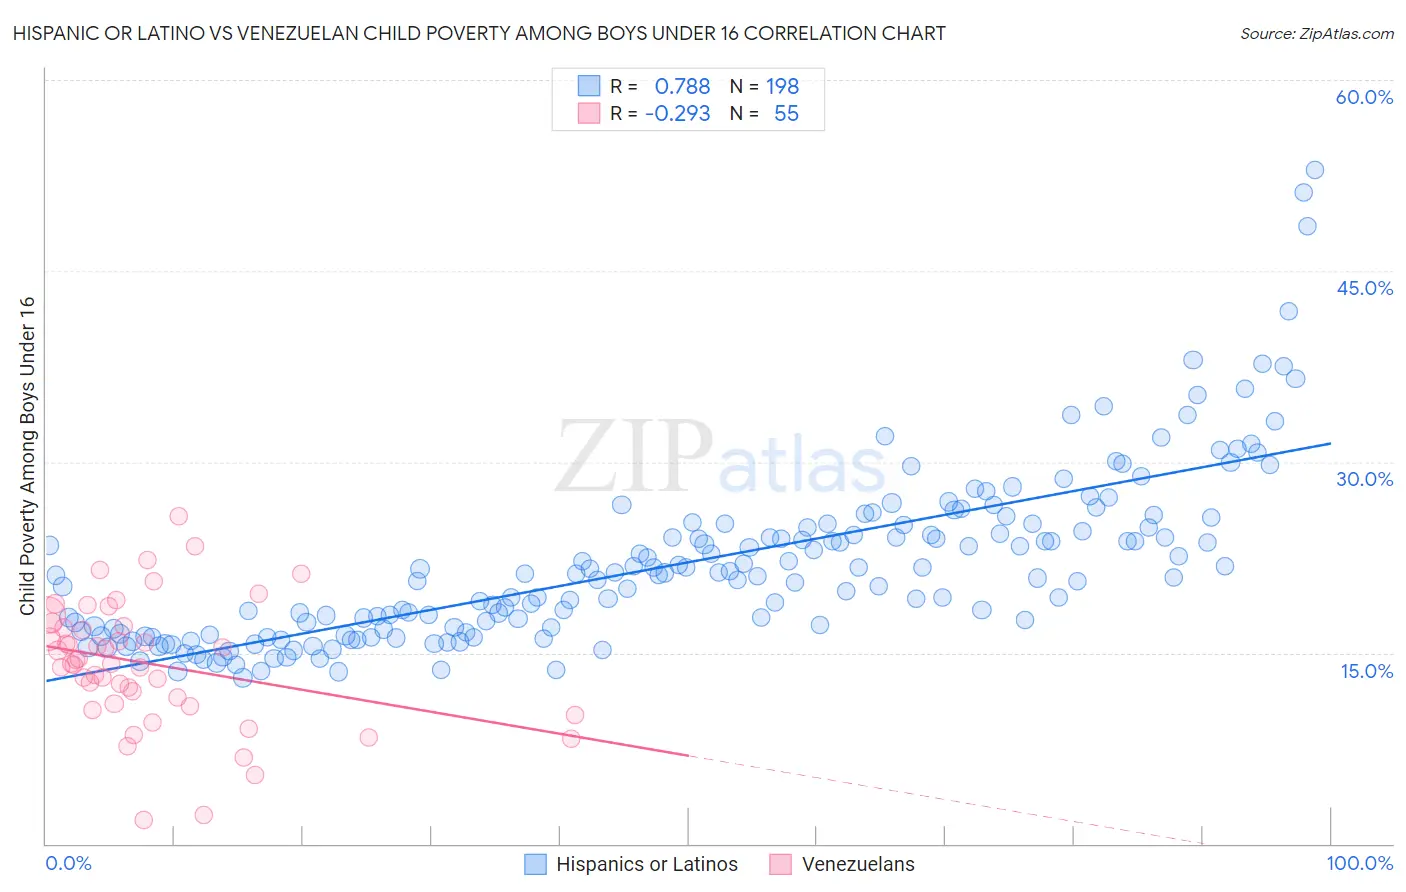
Hispanic or Latino vs Venezuelan Child Poverty Among Boys Under 16 Correlation Chart
The statistical analysis conducted on geographies consisting of 554,167,718 people shows a strong positive correlation between the proportion of Hispanics or Latinos and poverty level among boys under the age of 16 in the United States with a correlation coefficient (R) of 0.788 and weighted average of 20.9%. Similarly, the statistical analysis conducted on geographies consisting of 302,859,424 people shows a weak negative correlation between the proportion of Venezuelans and poverty level among boys under the age of 16 in the United States with a correlation coefficient (R) of -0.293 and weighted average of 15.7%, a difference of 32.9%.
Child Poverty Among Boys Under 16 Correlation Summary
| Measurement | Hispanic or Latino | Venezuelan |
| Minimum | 13.0% | 1.9% |
| Maximum | 53.0% | 25.8% |
| Range | 39.9% | 23.9% |
| Mean | 22.0% | 14.2% |
| Median | 21.1% | 14.2% |
| Interquartile 25% (IQ1) | 16.8% | 11.0% |
| Interquartile 75% (IQ3) | 24.9% | 17.1% |
| Interquartile Range (IQR) | 8.0% | 6.1% |
| Standard Deviation (Sample) | 6.8% | 4.9% |
| Standard Deviation (Population) | 6.8% | 4.9% |
Similar Demographics by Child Poverty Among Boys Under 16
Demographics Similar to Hispanics or Latinos by Child Poverty Among Boys Under 16
In terms of child poverty among boys under 16, the demographic groups most similar to Hispanics or Latinos are Chippewa (21.0%, a difference of 0.26%), Immigrants from Caribbean (21.0%, a difference of 0.53%), Haitian (21.0%, a difference of 0.58%), Indonesian (20.8%, a difference of 0.61%), and Mexican (20.7%, a difference of 0.80%).
| Demographics | Rating | Rank | Child Poverty Among Boys Under 16 |
| Senegalese | 0.0 /100 | #290 | Tragic 20.6% |
| Immigrants | Latin America | 0.0 /100 | #291 | Tragic 20.6% |
| Yaqui | 0.0 /100 | #292 | Tragic 20.7% |
| Immigrants | Senegal | 0.0 /100 | #293 | Tragic 20.7% |
| Immigrants | Bahamas | 0.0 /100 | #294 | Tragic 20.7% |
| Mexicans | 0.0 /100 | #295 | Tragic 20.7% |
| Indonesians | 0.0 /100 | #296 | Tragic 20.8% |
| Hispanics or Latinos | 0.0 /100 | #297 | Tragic 20.9% |
| Chippewa | 0.0 /100 | #298 | Tragic 21.0% |
| Immigrants | Caribbean | 0.0 /100 | #299 | Tragic 21.0% |
| Haitians | 0.0 /100 | #300 | Tragic 21.0% |
| Guatemalans | 0.0 /100 | #301 | Tragic 21.1% |
| Somalis | 0.0 /100 | #302 | Tragic 21.1% |
| Immigrants | Haiti | 0.0 /100 | #303 | Tragic 21.3% |
| Immigrants | Central America | 0.0 /100 | #304 | Tragic 21.3% |
Demographics Similar to Venezuelans by Child Poverty Among Boys Under 16
In terms of child poverty among boys under 16, the demographic groups most similar to Venezuelans are New Zealander (15.7%, a difference of 0.070%), Brazilian (15.8%, a difference of 0.20%), Samoan (15.7%, a difference of 0.22%), Immigrants from Peru (15.7%, a difference of 0.28%), and Immigrants from Fiji (15.7%, a difference of 0.30%).
| Demographics | Rating | Rank | Child Poverty Among Boys Under 16 |
| Immigrants | Kuwait | 85.6 /100 | #140 | Excellent 15.6% |
| Slavs | 84.5 /100 | #141 | Excellent 15.7% |
| Immigrants | Hungary | 84.1 /100 | #142 | Excellent 15.7% |
| Immigrants | Fiji | 83.6 /100 | #143 | Excellent 15.7% |
| Immigrants | Peru | 83.5 /100 | #144 | Excellent 15.7% |
| Samoans | 83.2 /100 | #145 | Excellent 15.7% |
| New Zealanders | 82.4 /100 | #146 | Excellent 15.7% |
| Venezuelans | 82.1 /100 | #147 | Excellent 15.7% |
| Brazilians | 81.0 /100 | #148 | Excellent 15.8% |
| Slovaks | 80.3 /100 | #149 | Excellent 15.8% |
| Immigrants | Jordan | 80.2 /100 | #150 | Excellent 15.8% |
| Puget Sound Salish | 79.8 /100 | #151 | Good 15.8% |
| Immigrants | Venezuela | 79.5 /100 | #152 | Good 15.8% |
| French | 78.7 /100 | #153 | Good 15.8% |
| Syrians | 77.5 /100 | #154 | Good 15.9% |