Hispanic or Latino vs Delaware Child Poverty Under the Age of 16
COMPARE
Hispanic or Latino
Delaware
Child Poverty Under the Age of 16
Child Poverty Under the Age of 16 Comparison
Hispanics or Latinos
Delaware
20.8%
CHILD POVERTY UNDER THE AGE OF 16
0.0/ 100
METRIC RATING
297th/ 347
METRIC RANK
17.0%
CHILD POVERTY UNDER THE AGE OF 16
17.1/ 100
METRIC RATING
198th/ 347
METRIC RANK
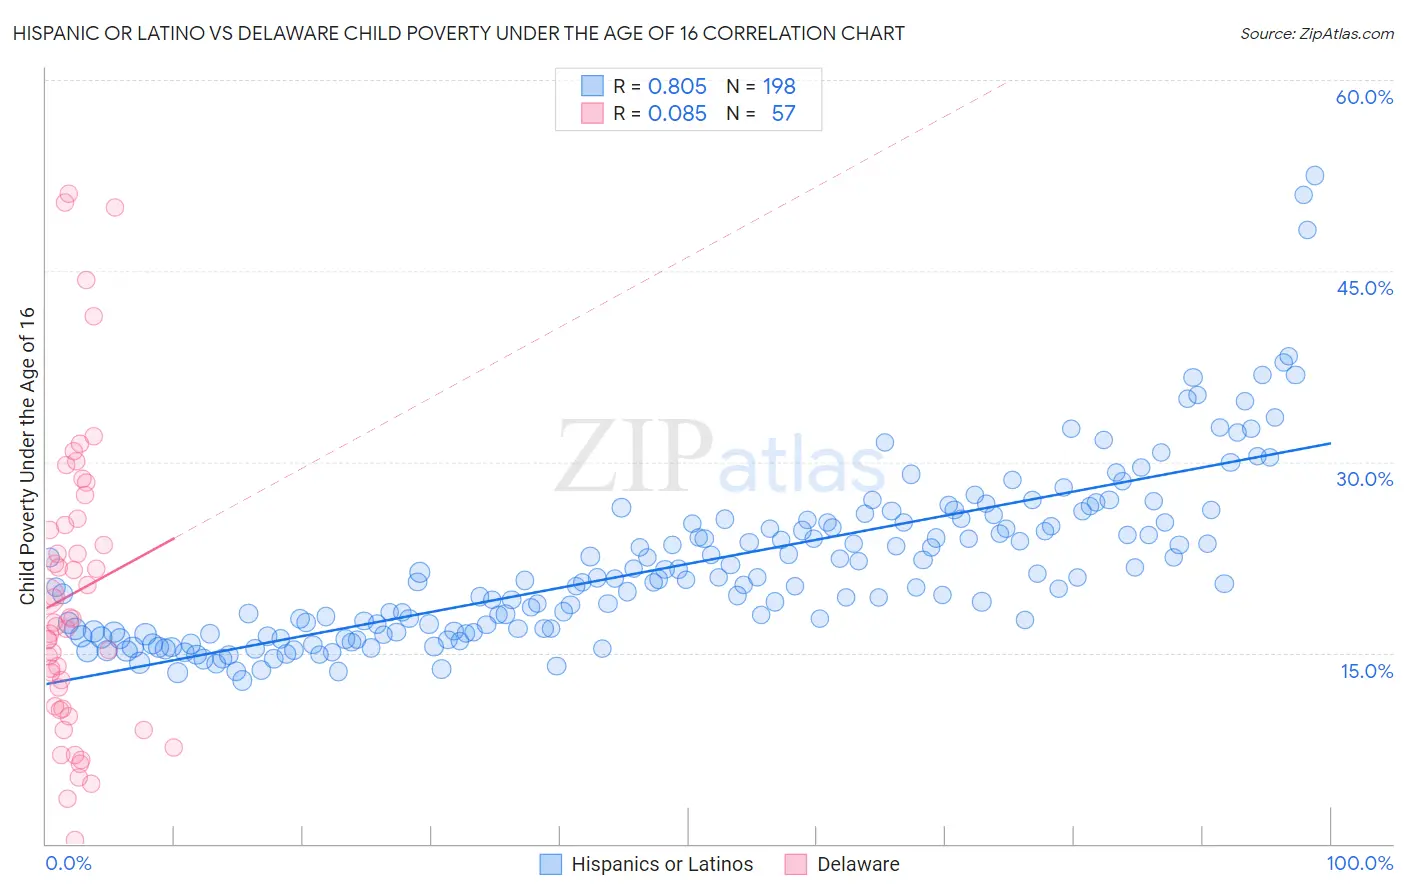
Hispanic or Latino vs Delaware Child Poverty Under the Age of 16 Correlation Chart
The statistical analysis conducted on geographies consisting of 562,230,949 people shows a very strong positive correlation between the proportion of Hispanics or Latinos and poverty level among children under the age of 16 in the United States with a correlation coefficient (R) of 0.805 and weighted average of 20.8%. Similarly, the statistical analysis conducted on geographies consisting of 95,926,108 people shows a slight positive correlation between the proportion of Delaware and poverty level among children under the age of 16 in the United States with a correlation coefficient (R) of 0.085 and weighted average of 17.0%, a difference of 22.5%.
Child Poverty Under the Age of 16 Correlation Summary
| Measurement | Hispanic or Latino | Delaware |
| Minimum | 12.8% | 0.33% |
| Maximum | 52.5% | 51.0% |
| Range | 39.7% | 50.7% |
| Mean | 21.9% | 19.7% |
| Median | 20.6% | 17.4% |
| Interquartile 25% (IQ1) | 16.6% | 10.7% |
| Interquartile 75% (IQ3) | 25.2% | 25.3% |
| Interquartile Range (IQR) | 8.6% | 14.6% |
| Standard Deviation (Sample) | 6.7% | 11.7% |
| Standard Deviation (Population) | 6.7% | 11.6% |
Similar Demographics by Child Poverty Under the Age of 16
Demographics Similar to Hispanics or Latinos by Child Poverty Under the Age of 16
In terms of child poverty under the age of 16, the demographic groups most similar to Hispanics or Latinos are Arapaho (20.8%, a difference of 0.0%), Immigrants from Caribbean (20.8%, a difference of 0.13%), Immigrants from Haiti (20.9%, a difference of 0.31%), Mexican (20.7%, a difference of 0.51%), and Haitian (20.7%, a difference of 0.65%).
| Demographics | Rating | Rank | Child Poverty Under the Age of 16 |
| Yaqui | 0.0 /100 | #290 | Tragic 20.4% |
| Chippewa | 0.0 /100 | #291 | Tragic 20.5% |
| Immigrants | Latin America | 0.0 /100 | #292 | Tragic 20.5% |
| Immigrants | Senegal | 0.0 /100 | #293 | Tragic 20.6% |
| Haitians | 0.0 /100 | #294 | Tragic 20.7% |
| Mexicans | 0.0 /100 | #295 | Tragic 20.7% |
| Immigrants | Caribbean | 0.0 /100 | #296 | Tragic 20.8% |
| Hispanics or Latinos | 0.0 /100 | #297 | Tragic 20.8% |
| Arapaho | 0.0 /100 | #298 | Tragic 20.8% |
| Immigrants | Haiti | 0.0 /100 | #299 | Tragic 20.9% |
| Indonesians | 0.0 /100 | #300 | Tragic 21.0% |
| Immigrants | Grenada | 0.0 /100 | #301 | Tragic 21.0% |
| Immigrants | Bahamas | 0.0 /100 | #302 | Tragic 21.0% |
| Choctaw | 0.0 /100 | #303 | Tragic 21.0% |
| Somalis | 0.0 /100 | #304 | Tragic 21.0% |
Demographics Similar to Delaware by Child Poverty Under the Age of 16
In terms of child poverty under the age of 16, the demographic groups most similar to Delaware are Immigrants from Kenya (16.9%, a difference of 0.40%), Immigrants from Afghanistan (17.0%, a difference of 0.41%), Immigrants from Cameroon (17.1%, a difference of 0.51%), Immigrants from Uzbekistan (17.1%, a difference of 0.52%), and Ugandan (17.1%, a difference of 0.60%).
| Demographics | Rating | Rank | Child Poverty Under the Age of 16 |
| Immigrants | Iraq | 28.3 /100 | #191 | Fair 16.7% |
| Spanish | 24.5 /100 | #192 | Fair 16.7% |
| Spaniards | 23.2 /100 | #193 | Fair 16.8% |
| Immigrants | Uruguay | 23.1 /100 | #194 | Fair 16.8% |
| Immigrants | Uganda | 22.5 /100 | #195 | Fair 16.8% |
| Immigrants | Lebanon | 22.0 /100 | #196 | Fair 16.8% |
| Immigrants | Kenya | 19.1 /100 | #197 | Poor 16.9% |
| Delaware | 17.1 /100 | #198 | Poor 17.0% |
| Immigrants | Afghanistan | 15.1 /100 | #199 | Poor 17.0% |
| Immigrants | Cameroon | 14.7 /100 | #200 | Poor 17.1% |
| Immigrants | Uzbekistan | 14.7 /100 | #201 | Poor 17.1% |
| Ugandans | 14.3 /100 | #202 | Poor 17.1% |
| Immigrants | Sierra Leone | 14.2 /100 | #203 | Poor 17.1% |
| Hmong | 14.0 /100 | #204 | Poor 17.1% |
| Aleuts | 13.9 /100 | #205 | Poor 17.1% |