Hispanic or Latino vs Asian Family Poverty
COMPARE
Hispanic or Latino
Asian
Family Poverty
Family Poverty Comparison
Hispanics or Latinos
Asians
12.0%
FAMILY POVERTY
0.0/ 100
METRIC RATING
309th/ 347
METRIC RANK
7.7%
FAMILY POVERTY
98.7/ 100
METRIC RATING
57th/ 347
METRIC RANK
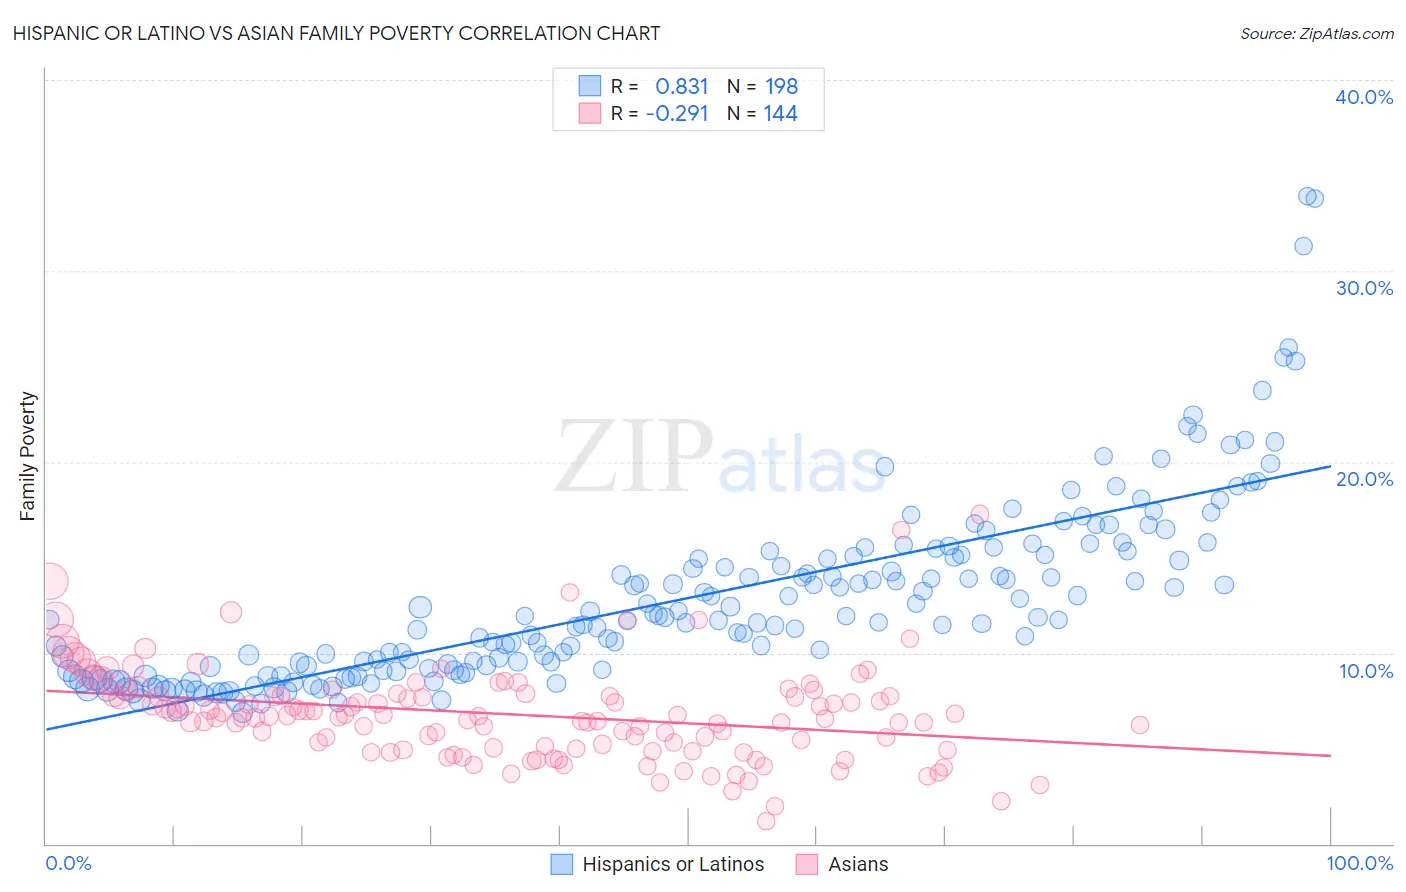
Hispanic or Latino vs Asian Family Poverty Correlation Chart
The statistical analysis conducted on geographies consisting of 570,393,322 people shows a very strong positive correlation between the proportion of Hispanics or Latinos and poverty level among families in the United States with a correlation coefficient (R) of 0.831 and weighted average of 12.0%. Similarly, the statistical analysis conducted on geographies consisting of 547,164,240 people shows a weak negative correlation between the proportion of Asians and poverty level among families in the United States with a correlation coefficient (R) of -0.291 and weighted average of 7.7%, a difference of 54.7%.
Family Poverty Correlation Summary
| Measurement | Hispanic or Latino | Asian |
| Minimum | 6.9% | 1.2% |
| Maximum | 33.9% | 17.3% |
| Range | 27.0% | 16.1% |
| Mean | 12.8% | 6.8% |
| Median | 11.7% | 6.7% |
| Interquartile 25% (IQ1) | 9.1% | 5.0% |
| Interquartile 75% (IQ3) | 15.0% | 7.7% |
| Interquartile Range (IQR) | 6.0% | 2.7% |
| Standard Deviation (Sample) | 4.8% | 2.5% |
| Standard Deviation (Population) | 4.7% | 2.5% |
Similar Demographics by Family Poverty
Demographics Similar to Hispanics or Latinos by Family Poverty
In terms of family poverty, the demographic groups most similar to Hispanics or Latinos are Immigrants from Guatemala (12.0%, a difference of 0.0%), Seminole (11.9%, a difference of 0.45%), Immigrants from Congo (11.9%, a difference of 0.50%), Cajun (11.9%, a difference of 0.61%), and Ute (12.1%, a difference of 0.84%).
| Demographics | Rating | Rank | Family Poverty |
| Guatemalans | 0.0 /100 | #302 | Tragic 11.7% |
| Africans | 0.0 /100 | #303 | Tragic 11.8% |
| Immigrants | Latin America | 0.0 /100 | #304 | Tragic 11.8% |
| Mexicans | 0.0 /100 | #305 | Tragic 11.8% |
| Cajuns | 0.0 /100 | #306 | Tragic 11.9% |
| Immigrants | Congo | 0.0 /100 | #307 | Tragic 11.9% |
| Seminole | 0.0 /100 | #308 | Tragic 11.9% |
| Hispanics or Latinos | 0.0 /100 | #309 | Tragic 12.0% |
| Immigrants | Guatemala | 0.0 /100 | #310 | Tragic 12.0% |
| Ute | 0.0 /100 | #311 | Tragic 12.1% |
| Immigrants | Central America | 0.0 /100 | #312 | Tragic 12.1% |
| Immigrants | Caribbean | 0.0 /100 | #313 | Tragic 12.2% |
| Kiowa | 0.0 /100 | #314 | Tragic 12.2% |
| Immigrants | Mexico | 0.0 /100 | #315 | Tragic 12.3% |
| Hondurans | 0.0 /100 | #316 | Tragic 12.4% |
Demographics Similar to Asians by Family Poverty
In terms of family poverty, the demographic groups most similar to Asians are Finnish (7.7%, a difference of 0.030%), European (7.7%, a difference of 0.040%), Immigrants from Greece (7.7%, a difference of 0.050%), Immigrants from Serbia (7.7%, a difference of 0.090%), and Immigrants from Eastern Asia (7.7%, a difference of 0.13%).
| Demographics | Rating | Rank | Family Poverty |
| Immigrants | North Macedonia | 98.9 /100 | #50 | Exceptional 7.7% |
| Immigrants | Moldova | 98.8 /100 | #51 | Exceptional 7.7% |
| Indians (Asian) | 98.8 /100 | #52 | Exceptional 7.7% |
| Swiss | 98.8 /100 | #53 | Exceptional 7.7% |
| Immigrants | Sweden | 98.8 /100 | #54 | Exceptional 7.7% |
| Immigrants | Eastern Asia | 98.7 /100 | #55 | Exceptional 7.7% |
| Immigrants | Serbia | 98.7 /100 | #56 | Exceptional 7.7% |
| Asians | 98.7 /100 | #57 | Exceptional 7.7% |
| Finns | 98.7 /100 | #58 | Exceptional 7.7% |
| Europeans | 98.7 /100 | #59 | Exceptional 7.7% |
| Immigrants | Greece | 98.7 /100 | #60 | Exceptional 7.7% |
| Immigrants | Netherlands | 98.6 /100 | #61 | Exceptional 7.7% |
| Macedonians | 98.6 /100 | #62 | Exceptional 7.8% |
| Zimbabweans | 98.4 /100 | #63 | Exceptional 7.8% |
| Koreans | 98.3 /100 | #64 | Exceptional 7.8% |