Hawaiian vs Russian Single Male Poverty
COMPARE
Hawaiian
Russian
Single Male Poverty
Single Male Poverty Comparison
Hawaiians
Russians
12.6%
SINGLE MALE POVERTY
75.1/ 100
METRIC RATING
144th/ 347
METRIC RANK
12.5%
SINGLE MALE POVERTY
87.3/ 100
METRIC RATING
124th/ 347
METRIC RANK
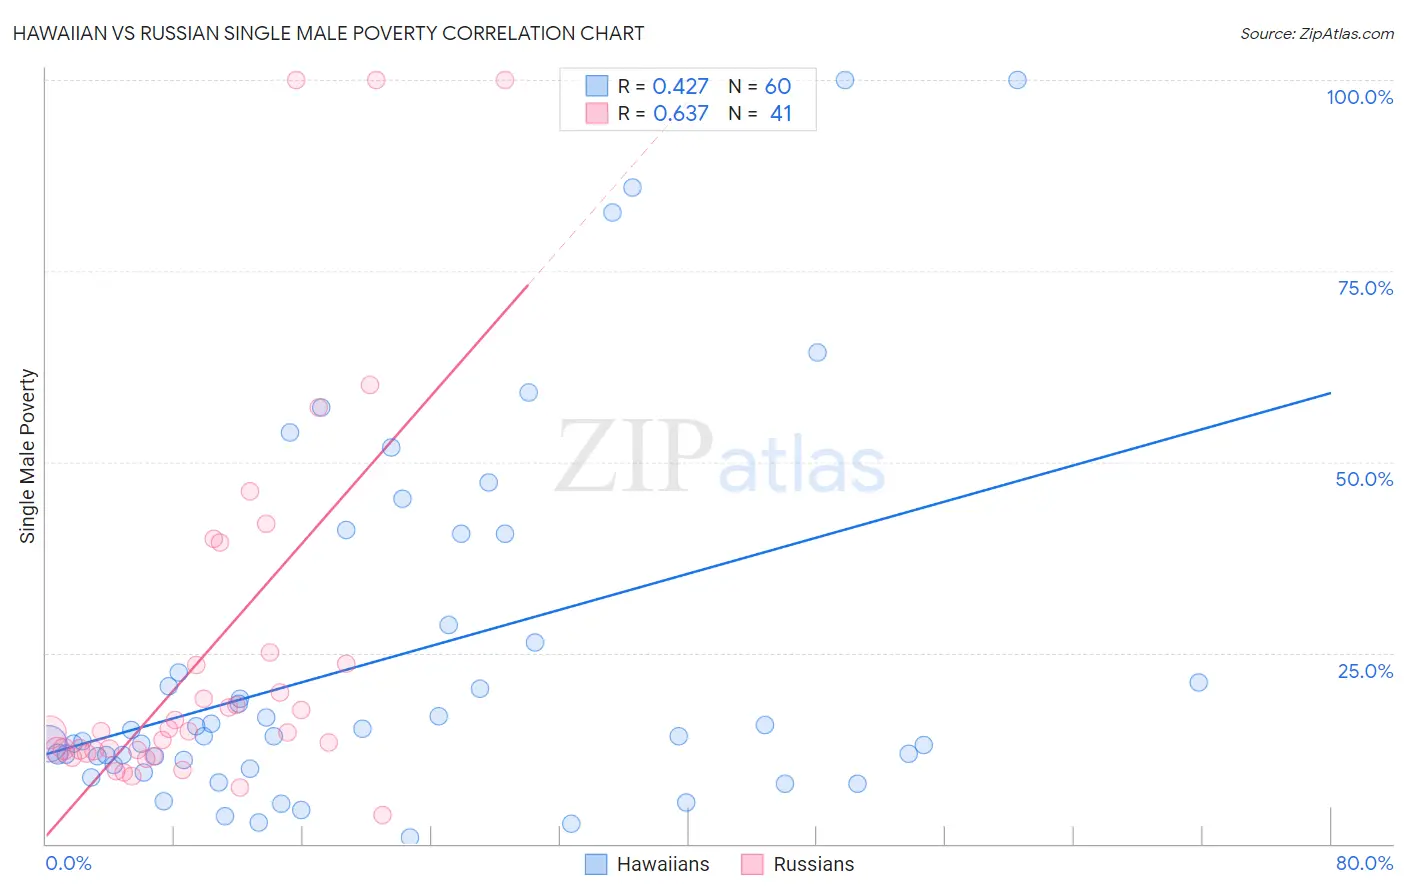
Hawaiian vs Russian Single Male Poverty Correlation Chart
The statistical analysis conducted on geographies consisting of 300,272,441 people shows a moderate positive correlation between the proportion of Hawaiians and poverty level among single males in the United States with a correlation coefficient (R) of 0.427 and weighted average of 12.6%. Similarly, the statistical analysis conducted on geographies consisting of 432,544,064 people shows a significant positive correlation between the proportion of Russians and poverty level among single males in the United States with a correlation coefficient (R) of 0.637 and weighted average of 12.5%, a difference of 1.1%.
Single Male Poverty Correlation Summary
| Measurement | Hawaiian | Russian |
| Minimum | 0.75% | 3.8% |
| Maximum | 100.0% | 100.0% |
| Range | 99.3% | 96.2% |
| Mean | 24.1% | 25.2% |
| Median | 14.1% | 14.7% |
| Interquartile 25% (IQ1) | 10.7% | 12.0% |
| Interquartile 75% (IQ3) | 27.4% | 24.3% |
| Interquartile Range (IQR) | 16.7% | 12.2% |
| Standard Deviation (Sample) | 24.0% | 24.9% |
| Standard Deviation (Population) | 23.8% | 24.6% |
Demographics Similar to Hawaiians and Russians by Single Male Poverty
In terms of single male poverty, the demographic groups most similar to Hawaiians are Immigrants from France (12.6%, a difference of 0.050%), Okinawan (12.6%, a difference of 0.060%), Immigrants from Uganda (12.6%, a difference of 0.060%), Immigrants from Zimbabwe (12.6%, a difference of 0.22%), and Cuban (12.6%, a difference of 0.37%). Similarly, the demographic groups most similar to Russians are Immigrants from Jordan (12.5%, a difference of 0.030%), Romanian (12.5%, a difference of 0.11%), Immigrants from Netherlands (12.5%, a difference of 0.13%), Ecuadorian (12.5%, a difference of 0.17%), and Immigrants from Sierra Leone (12.5%, a difference of 0.20%).
| Demographics | Rating | Rank | Single Male Poverty |
| Russians | 87.3 /100 | #124 | Excellent 12.5% |
| Immigrants | Jordan | 87.1 /100 | #125 | Excellent 12.5% |
| Romanians | 86.4 /100 | #126 | Excellent 12.5% |
| Immigrants | Netherlands | 86.2 /100 | #127 | Excellent 12.5% |
| Ecuadorians | 85.9 /100 | #128 | Excellent 12.5% |
| Immigrants | Sierra Leone | 85.5 /100 | #129 | Excellent 12.5% |
| Immigrants | Nicaragua | 84.8 /100 | #130 | Excellent 12.5% |
| Immigrants | Northern Europe | 83.7 /100 | #131 | Excellent 12.5% |
| Salvadorans | 83.7 /100 | #132 | Excellent 12.5% |
| Immigrants | Western Asia | 83.4 /100 | #133 | Excellent 12.5% |
| Immigrants | Ecuador | 82.1 /100 | #134 | Excellent 12.5% |
| Immigrants | Costa Rica | 81.9 /100 | #135 | Excellent 12.5% |
| Immigrants | Austria | 81.9 /100 | #136 | Excellent 12.5% |
| Ukrainians | 80.7 /100 | #137 | Excellent 12.6% |
| Immigrants | El Salvador | 80.0 /100 | #138 | Excellent 12.6% |
| Cubans | 79.9 /100 | #139 | Good 12.6% |
| Immigrants | Zimbabwe | 78.0 /100 | #140 | Good 12.6% |
| Okinawans | 75.9 /100 | #141 | Good 12.6% |
| Immigrants | Uganda | 75.9 /100 | #142 | Good 12.6% |
| Immigrants | France | 75.8 /100 | #143 | Good 12.6% |
| Hawaiians | 75.1 /100 | #144 | Good 12.6% |