Guatemalan vs Immigrants from Latvia Male Poverty
COMPARE
Guatemalan
Immigrants from Latvia
Male Poverty
Male Poverty Comparison
Guatemalans
Immigrants from Latvia
13.8%
MALE POVERTY
0.0/ 100
METRIC RATING
289th/ 347
METRIC RANK
10.5%
MALE POVERTY
92.8/ 100
METRIC RATING
100th/ 347
METRIC RANK
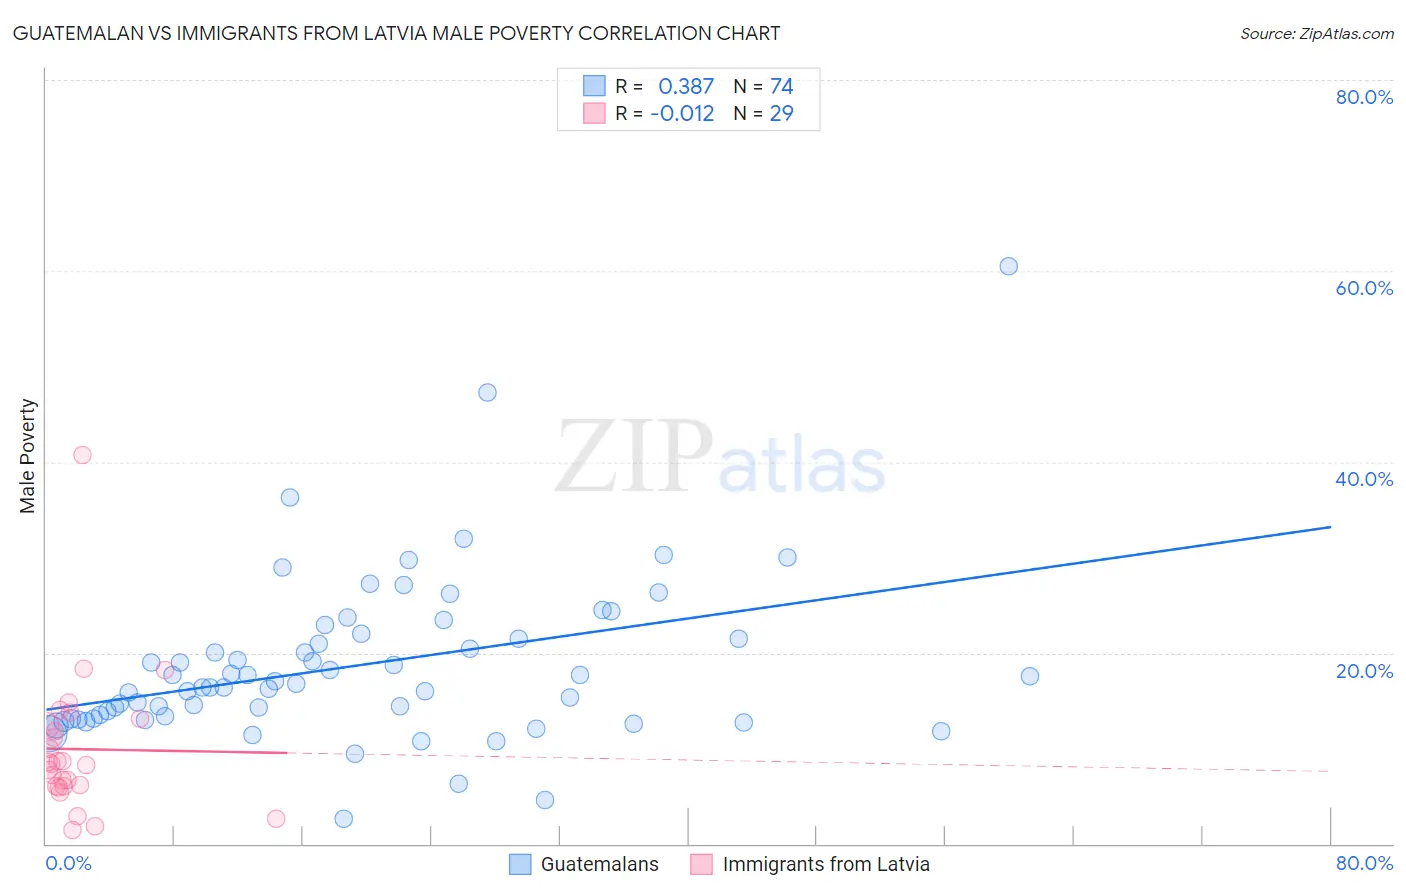
Guatemalan vs Immigrants from Latvia Male Poverty Correlation Chart
The statistical analysis conducted on geographies consisting of 409,206,123 people shows a mild positive correlation between the proportion of Guatemalans and poverty level among males in the United States with a correlation coefficient (R) of 0.387 and weighted average of 13.8%. Similarly, the statistical analysis conducted on geographies consisting of 113,727,577 people shows no correlation between the proportion of Immigrants from Latvia and poverty level among males in the United States with a correlation coefficient (R) of -0.012 and weighted average of 10.5%, a difference of 31.7%.
Male Poverty Correlation Summary
| Measurement | Guatemalan | Immigrants from Latvia |
| Minimum | 2.7% | 1.5% |
| Maximum | 60.5% | 40.7% |
| Range | 57.9% | 39.2% |
| Mean | 18.7% | 9.9% |
| Median | 16.6% | 8.3% |
| Interquartile 25% (IQ1) | 13.1% | 6.1% |
| Interquartile 75% (IQ3) | 21.5% | 12.8% |
| Interquartile Range (IQR) | 8.4% | 6.7% |
| Standard Deviation (Sample) | 8.7% | 7.4% |
| Standard Deviation (Population) | 8.7% | 7.2% |
Similar Demographics by Male Poverty
Demographics Similar to Guatemalans by Male Poverty
In terms of male poverty, the demographic groups most similar to Guatemalans are Immigrants from Zaire (13.8%, a difference of 0.010%), Vietnamese (13.8%, a difference of 0.10%), Immigrants from St. Vincent and the Grenadines (13.8%, a difference of 0.17%), Indonesian (13.8%, a difference of 0.26%), and Immigrants from Belize (13.8%, a difference of 0.27%).
| Demographics | Rating | Rank | Male Poverty |
| Immigrants | Cabo Verde | 0.0 /100 | #282 | Tragic 13.7% |
| Comanche | 0.0 /100 | #283 | Tragic 13.8% |
| Immigrants | Haiti | 0.0 /100 | #284 | Tragic 13.8% |
| West Indians | 0.0 /100 | #285 | Tragic 13.8% |
| Shoshone | 0.0 /100 | #286 | Tragic 13.8% |
| Immigrants | Barbados | 0.0 /100 | #287 | Tragic 13.8% |
| Immigrants | St. Vincent and the Grenadines | 0.0 /100 | #288 | Tragic 13.8% |
| Guatemalans | 0.0 /100 | #289 | Tragic 13.8% |
| Immigrants | Zaire | 0.0 /100 | #290 | Tragic 13.8% |
| Vietnamese | 0.0 /100 | #291 | Tragic 13.8% |
| Indonesians | 0.0 /100 | #292 | Tragic 13.8% |
| Immigrants | Belize | 0.0 /100 | #293 | Tragic 13.8% |
| Hispanics or Latinos | 0.0 /100 | #294 | Tragic 13.9% |
| Immigrants | Central America | 0.0 /100 | #295 | Tragic 13.9% |
| Cajuns | 0.0 /100 | #296 | Tragic 13.9% |
Demographics Similar to Immigrants from Latvia by Male Poverty
In terms of male poverty, the demographic groups most similar to Immigrants from Latvia are Immigrants from Indonesia (10.5%, a difference of 0.21%), Finnish (10.5%, a difference of 0.28%), Immigrants from Zimbabwe (10.5%, a difference of 0.29%), French Canadian (10.5%, a difference of 0.30%), and Romanian (10.5%, a difference of 0.34%).
| Demographics | Rating | Rank | Male Poverty |
| Australians | 94.4 /100 | #93 | Exceptional 10.4% |
| Immigrants | South Africa | 94.1 /100 | #94 | Exceptional 10.4% |
| Scottish | 94.0 /100 | #95 | Exceptional 10.4% |
| Immigrants | Egypt | 93.7 /100 | #96 | Exceptional 10.4% |
| Romanians | 93.6 /100 | #97 | Exceptional 10.5% |
| Finns | 93.4 /100 | #98 | Exceptional 10.5% |
| Immigrants | Indonesia | 93.3 /100 | #99 | Exceptional 10.5% |
| Immigrants | Latvia | 92.8 /100 | #100 | Exceptional 10.5% |
| Immigrants | Zimbabwe | 92.0 /100 | #101 | Exceptional 10.5% |
| French Canadians | 91.9 /100 | #102 | Exceptional 10.5% |
| Slavs | 91.7 /100 | #103 | Exceptional 10.5% |
| Welsh | 91.6 /100 | #104 | Exceptional 10.5% |
| Canadians | 91.6 /100 | #105 | Exceptional 10.5% |
| Immigrants | Southern Europe | 91.3 /100 | #106 | Exceptional 10.5% |
| Laotians | 91.2 /100 | #107 | Exceptional 10.5% |