Guatemalan vs Finnish Family Poverty
COMPARE
Guatemalan
Finnish
Family Poverty
Family Poverty Comparison
Guatemalans
Finns
11.7%
FAMILY POVERTY
0.0/ 100
METRIC RATING
302nd/ 347
METRIC RANK
7.7%
FAMILY POVERTY
98.7/ 100
METRIC RATING
58th/ 347
METRIC RANK
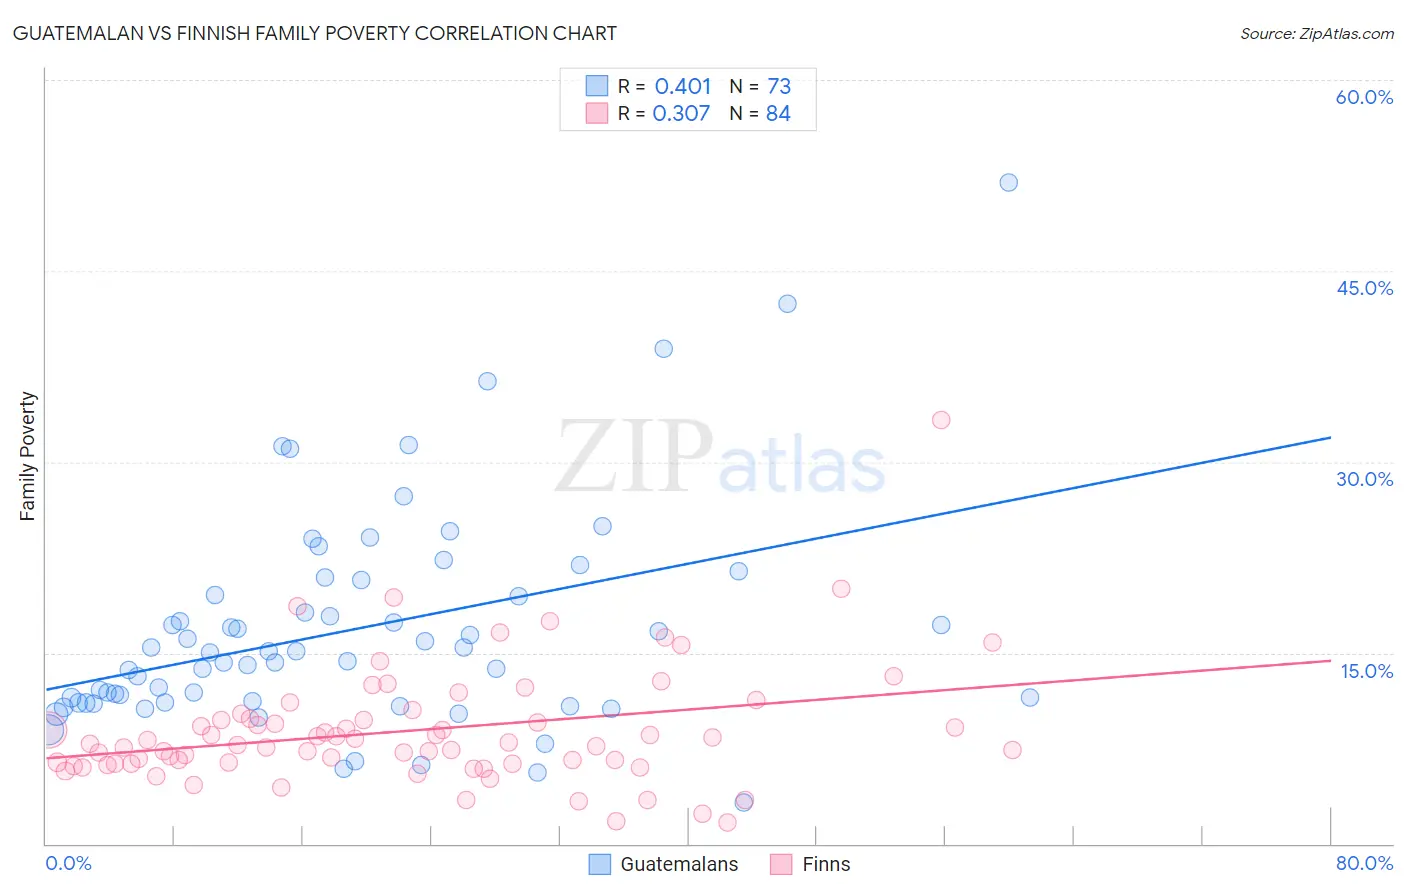
Guatemalan vs Finnish Family Poverty Correlation Chart
The statistical analysis conducted on geographies consisting of 408,686,067 people shows a moderate positive correlation between the proportion of Guatemalans and poverty level among families in the United States with a correlation coefficient (R) of 0.401 and weighted average of 11.7%. Similarly, the statistical analysis conducted on geographies consisting of 403,232,435 people shows a mild positive correlation between the proportion of Finns and poverty level among families in the United States with a correlation coefficient (R) of 0.307 and weighted average of 7.7%, a difference of 51.5%.
Family Poverty Correlation Summary
| Measurement | Guatemalan | Finnish |
| Minimum | 3.3% | 1.7% |
| Maximum | 51.9% | 33.3% |
| Range | 48.7% | 31.6% |
| Mean | 16.8% | 8.9% |
| Median | 15.0% | 7.8% |
| Interquartile 25% (IQ1) | 11.1% | 6.3% |
| Interquartile 75% (IQ3) | 20.1% | 9.8% |
| Interquartile Range (IQR) | 9.0% | 3.5% |
| Standard Deviation (Sample) | 8.7% | 4.7% |
| Standard Deviation (Population) | 8.6% | 4.7% |
Similar Demographics by Family Poverty
Demographics Similar to Guatemalans by Family Poverty
In terms of family poverty, the demographic groups most similar to Guatemalans are Bahamian (11.7%, a difference of 0.040%), Immigrants from Bangladesh (11.7%, a difference of 0.29%), Dutch West Indian (11.7%, a difference of 0.31%), Immigrants from Senegal (11.7%, a difference of 0.41%), and African (11.8%, a difference of 0.50%).
| Demographics | Rating | Rank | Family Poverty |
| Immigrants | Haiti | 0.0 /100 | #295 | Tragic 11.6% |
| Choctaw | 0.0 /100 | #296 | Tragic 11.6% |
| Creek | 0.0 /100 | #297 | Tragic 11.7% |
| Immigrants | Senegal | 0.0 /100 | #298 | Tragic 11.7% |
| Dutch West Indians | 0.0 /100 | #299 | Tragic 11.7% |
| Immigrants | Bangladesh | 0.0 /100 | #300 | Tragic 11.7% |
| Bahamians | 0.0 /100 | #301 | Tragic 11.7% |
| Guatemalans | 0.0 /100 | #302 | Tragic 11.7% |
| Africans | 0.0 /100 | #303 | Tragic 11.8% |
| Immigrants | Latin America | 0.0 /100 | #304 | Tragic 11.8% |
| Mexicans | 0.0 /100 | #305 | Tragic 11.8% |
| Cajuns | 0.0 /100 | #306 | Tragic 11.9% |
| Immigrants | Congo | 0.0 /100 | #307 | Tragic 11.9% |
| Seminole | 0.0 /100 | #308 | Tragic 11.9% |
| Hispanics or Latinos | 0.0 /100 | #309 | Tragic 12.0% |
Demographics Similar to Finns by Family Poverty
In terms of family poverty, the demographic groups most similar to Finns are European (7.7%, a difference of 0.010%), Immigrants from Greece (7.7%, a difference of 0.020%), Asian (7.7%, a difference of 0.030%), Immigrants from Serbia (7.7%, a difference of 0.12%), and Immigrants from Eastern Asia (7.7%, a difference of 0.16%).
| Demographics | Rating | Rank | Family Poverty |
| Immigrants | Moldova | 98.8 /100 | #51 | Exceptional 7.7% |
| Indians (Asian) | 98.8 /100 | #52 | Exceptional 7.7% |
| Swiss | 98.8 /100 | #53 | Exceptional 7.7% |
| Immigrants | Sweden | 98.8 /100 | #54 | Exceptional 7.7% |
| Immigrants | Eastern Asia | 98.7 /100 | #55 | Exceptional 7.7% |
| Immigrants | Serbia | 98.7 /100 | #56 | Exceptional 7.7% |
| Asians | 98.7 /100 | #57 | Exceptional 7.7% |
| Finns | 98.7 /100 | #58 | Exceptional 7.7% |
| Europeans | 98.7 /100 | #59 | Exceptional 7.7% |
| Immigrants | Greece | 98.7 /100 | #60 | Exceptional 7.7% |
| Immigrants | Netherlands | 98.6 /100 | #61 | Exceptional 7.7% |
| Macedonians | 98.6 /100 | #62 | Exceptional 7.8% |
| Zimbabweans | 98.4 /100 | #63 | Exceptional 7.8% |
| Koreans | 98.3 /100 | #64 | Exceptional 7.8% |
| Immigrants | Bulgaria | 98.3 /100 | #65 | Exceptional 7.8% |