Guatemalan vs Bulgarian Single Father Poverty
COMPARE
Guatemalan
Bulgarian
Single Father Poverty
Single Father Poverty Comparison
Guatemalans
Bulgarians
16.6%
SINGLE FATHER POVERTY
12.9/ 100
METRIC RATING
210th/ 347
METRIC RANK
15.8%
SINGLE FATHER POVERTY
94.8/ 100
METRIC RATING
111th/ 347
METRIC RANK
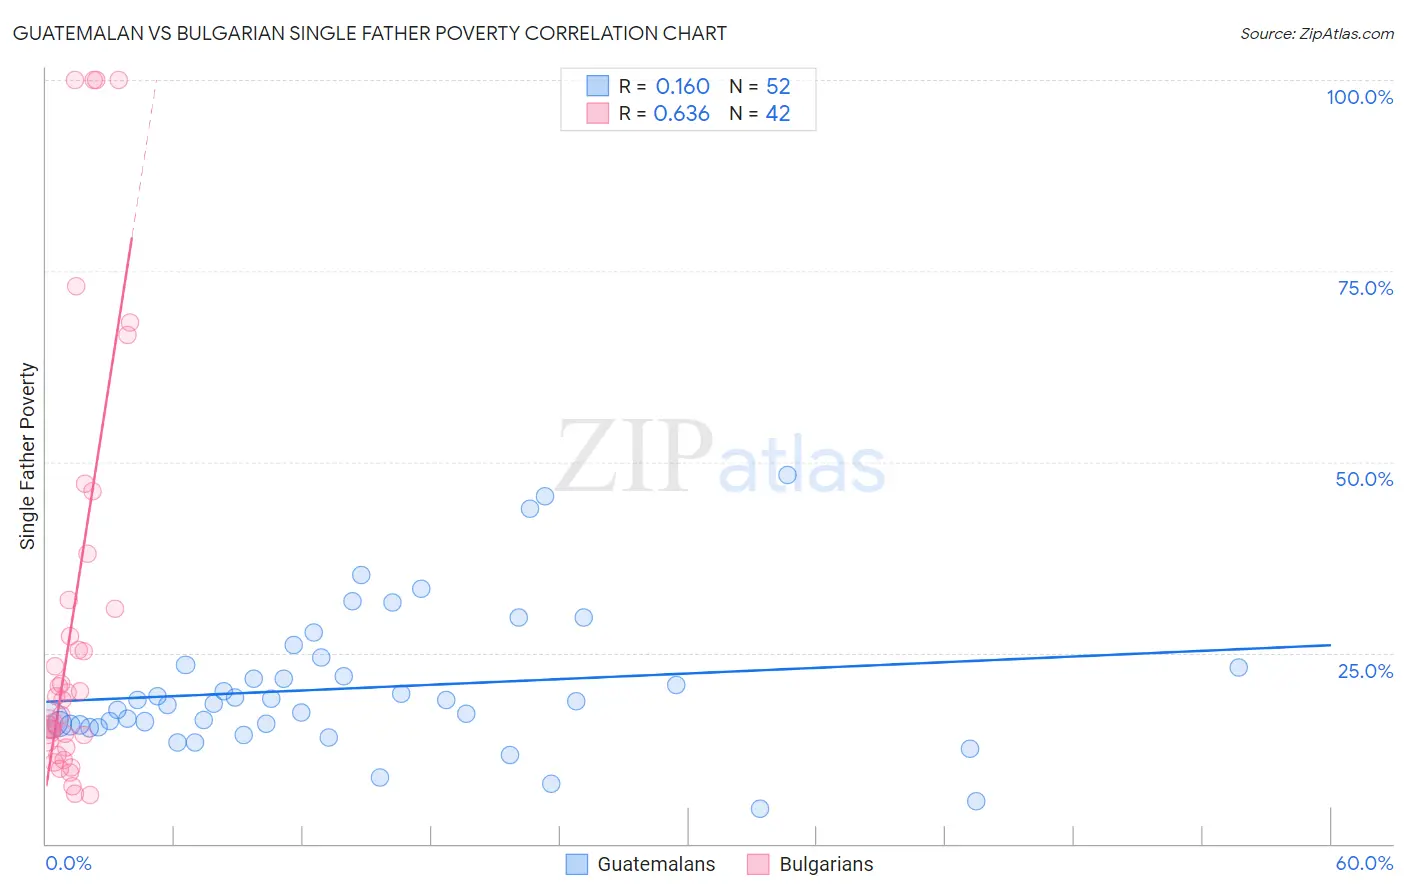
Guatemalan vs Bulgarian Single Father Poverty Correlation Chart
The statistical analysis conducted on geographies consisting of 326,782,810 people shows a poor positive correlation between the proportion of Guatemalans and poverty level among single fathers in the United States with a correlation coefficient (R) of 0.160 and weighted average of 16.6%. Similarly, the statistical analysis conducted on geographies consisting of 171,442,330 people shows a significant positive correlation between the proportion of Bulgarians and poverty level among single fathers in the United States with a correlation coefficient (R) of 0.636 and weighted average of 15.8%, a difference of 5.5%.
Single Father Poverty Correlation Summary
| Measurement | Guatemalan | Bulgarian |
| Minimum | 4.6% | 6.3% |
| Maximum | 48.3% | 100.0% |
| Range | 43.7% | 93.7% |
| Mean | 20.4% | 30.2% |
| Median | 18.6% | 19.1% |
| Interquartile 25% (IQ1) | 15.5% | 13.4% |
| Interquartile 75% (IQ3) | 23.2% | 32.0% |
| Interquartile Range (IQR) | 7.7% | 18.5% |
| Standard Deviation (Sample) | 9.1% | 27.9% |
| Standard Deviation (Population) | 9.1% | 27.6% |
Similar Demographics by Single Father Poverty
Demographics Similar to Guatemalans by Single Father Poverty
In terms of single father poverty, the demographic groups most similar to Guatemalans are Arab (16.6%, a difference of 0.0%), European (16.6%, a difference of 0.030%), New Zealander (16.6%, a difference of 0.070%), Eastern European (16.6%, a difference of 0.070%), and Immigrants from Senegal (16.6%, a difference of 0.080%).
| Demographics | Rating | Rank | Single Father Poverty |
| Immigrants | North America | 15.1 /100 | #203 | Poor 16.6% |
| Immigrants | Guatemala | 14.8 /100 | #204 | Poor 16.6% |
| Venezuelans | 14.3 /100 | #205 | Poor 16.6% |
| Immigrants | Senegal | 13.7 /100 | #206 | Poor 16.6% |
| New Zealanders | 13.7 /100 | #207 | Poor 16.6% |
| Eastern Europeans | 13.7 /100 | #208 | Poor 16.6% |
| Europeans | 13.2 /100 | #209 | Poor 16.6% |
| Guatemalans | 12.9 /100 | #210 | Poor 16.6% |
| Arabs | 12.8 /100 | #211 | Poor 16.6% |
| Immigrants | Southern Europe | 11.2 /100 | #212 | Poor 16.7% |
| Ghanaians | 11.0 /100 | #213 | Poor 16.7% |
| Spanish | 10.7 /100 | #214 | Poor 16.7% |
| Immigrants | Scotland | 9.6 /100 | #215 | Tragic 16.7% |
| Immigrants | England | 9.5 /100 | #216 | Tragic 16.7% |
| Cheyenne | 9.3 /100 | #217 | Tragic 16.7% |
Demographics Similar to Bulgarians by Single Father Poverty
In terms of single father poverty, the demographic groups most similar to Bulgarians are Immigrants from Latvia (15.8%, a difference of 0.030%), Immigrants from Africa (15.8%, a difference of 0.050%), Turkish (15.8%, a difference of 0.060%), Danish (15.8%, a difference of 0.080%), and Argentinean (15.8%, a difference of 0.090%).
| Demographics | Rating | Rank | Single Father Poverty |
| Australians | 96.1 /100 | #104 | Exceptional 15.7% |
| Immigrants | Australia | 96.1 /100 | #105 | Exceptional 15.7% |
| Immigrants | Poland | 95.8 /100 | #106 | Exceptional 15.7% |
| Native Hawaiians | 95.8 /100 | #107 | Exceptional 15.7% |
| Pakistanis | 95.7 /100 | #108 | Exceptional 15.7% |
| Turks | 95.1 /100 | #109 | Exceptional 15.8% |
| Immigrants | Africa | 95.1 /100 | #110 | Exceptional 15.8% |
| Bulgarians | 94.8 /100 | #111 | Exceptional 15.8% |
| Immigrants | Latvia | 94.7 /100 | #112 | Exceptional 15.8% |
| Danes | 94.5 /100 | #113 | Exceptional 15.8% |
| Argentineans | 94.4 /100 | #114 | Exceptional 15.8% |
| Immigrants | Thailand | 93.6 /100 | #115 | Exceptional 15.8% |
| Immigrants | Argentina | 92.8 /100 | #116 | Exceptional 15.8% |
| Immigrants | Colombia | 92.6 /100 | #117 | Exceptional 15.8% |
| Immigrants | Eastern Europe | 92.5 /100 | #118 | Exceptional 15.8% |