Guatemalan vs Arapaho Seniors Poverty Over the Age of 65
COMPARE
Guatemalan
Arapaho
Seniors Poverty Over the Age of 65
Seniors Poverty Over the Age of 65 Comparison
Guatemalans
Arapaho
13.5%
SENIORS POVERTY OVER THE AGE OF 65
0.0/ 100
METRIC RATING
285th/ 347
METRIC RANK
11.6%
SENIORS POVERTY OVER THE AGE OF 65
5.2/ 100
METRIC RATING
219th/ 347
METRIC RANK
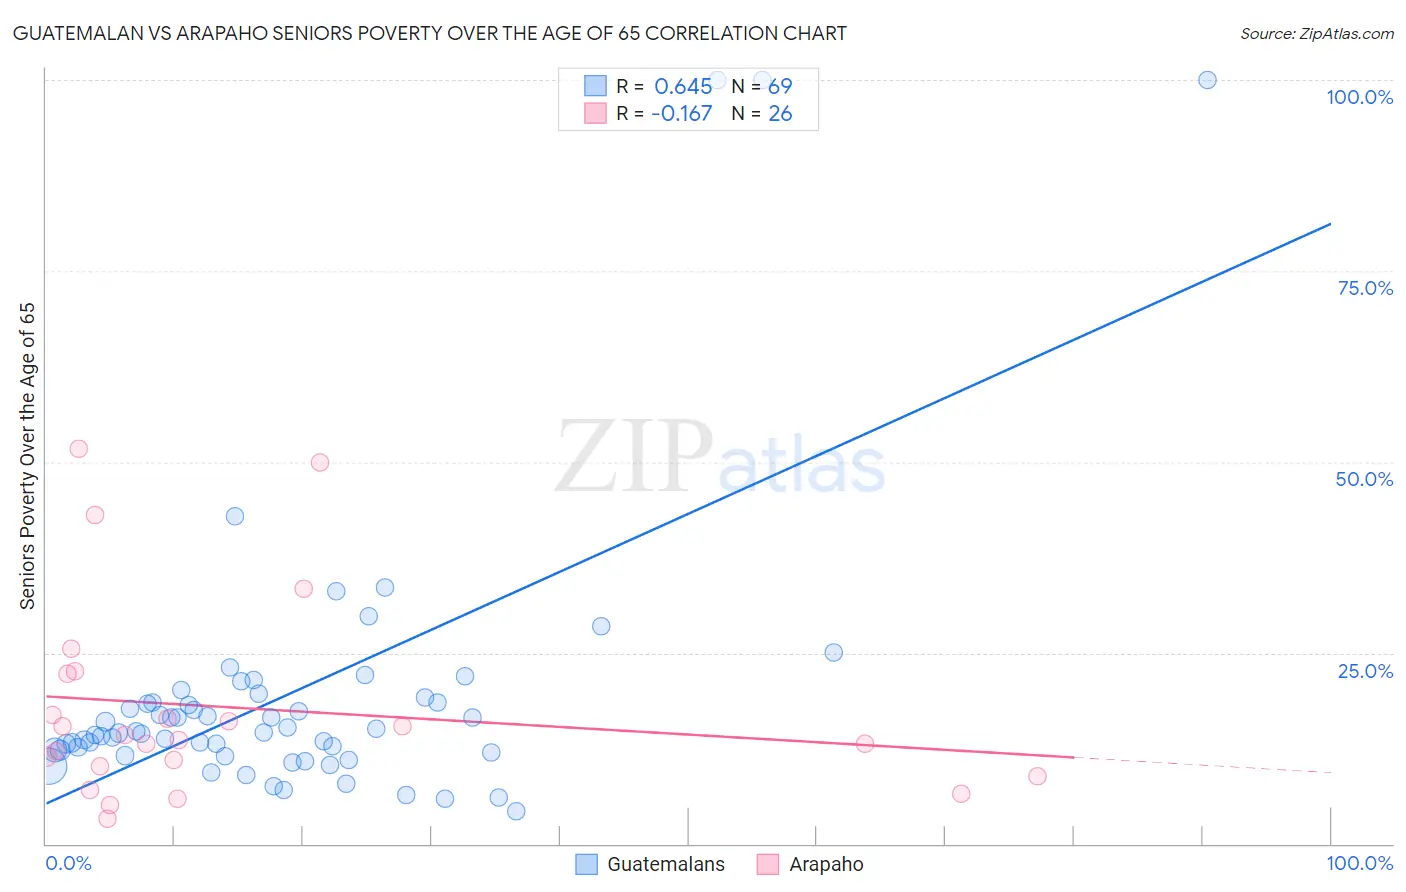
Guatemalan vs Arapaho Seniors Poverty Over the Age of 65 Correlation Chart
The statistical analysis conducted on geographies consisting of 408,127,156 people shows a significant positive correlation between the proportion of Guatemalans and poverty level among seniors over the age of 65 in the United States with a correlation coefficient (R) of 0.645 and weighted average of 13.5%. Similarly, the statistical analysis conducted on geographies consisting of 29,765,884 people shows a poor negative correlation between the proportion of Arapaho and poverty level among seniors over the age of 65 in the United States with a correlation coefficient (R) of -0.167 and weighted average of 11.6%, a difference of 16.3%.
Seniors Poverty Over the Age of 65 Correlation Summary
| Measurement | Guatemalan | Arapaho |
| Minimum | 4.3% | 3.2% |
| Maximum | 100.0% | 51.7% |
| Range | 95.7% | 48.5% |
| Mean | 19.4% | 17.8% |
| Median | 14.6% | 13.9% |
| Interquartile 25% (IQ1) | 12.1% | 10.2% |
| Interquartile 75% (IQ3) | 18.8% | 22.2% |
| Interquartile Range (IQR) | 6.8% | 12.0% |
| Standard Deviation (Sample) | 18.6% | 13.1% |
| Standard Deviation (Population) | 18.4% | 12.8% |
Similar Demographics by Seniors Poverty Over the Age of 65
Demographics Similar to Guatemalans by Seniors Poverty Over the Age of 65
In terms of seniors poverty over the age of 65, the demographic groups most similar to Guatemalans are Colville (13.5%, a difference of 0.23%), Immigrants from Senegal (13.6%, a difference of 0.27%), Immigrants from Mexico (13.6%, a difference of 0.40%), Belizean (13.6%, a difference of 0.54%), and Jamaican (13.6%, a difference of 0.81%).
| Demographics | Rating | Rank | Seniors Poverty Over the Age of 65 |
| Immigrants | Bahamas | 0.0 /100 | #278 | Tragic 13.0% |
| Mexicans | 0.0 /100 | #279 | Tragic 13.1% |
| Yuman | 0.0 /100 | #280 | Tragic 13.1% |
| Immigrants | El Salvador | 0.0 /100 | #281 | Tragic 13.1% |
| Senegalese | 0.0 /100 | #282 | Tragic 13.3% |
| Central Americans | 0.0 /100 | #283 | Tragic 13.4% |
| Colville | 0.0 /100 | #284 | Tragic 13.5% |
| Guatemalans | 0.0 /100 | #285 | Tragic 13.5% |
| Immigrants | Senegal | 0.0 /100 | #286 | Tragic 13.6% |
| Immigrants | Mexico | 0.0 /100 | #287 | Tragic 13.6% |
| Belizeans | 0.0 /100 | #288 | Tragic 13.6% |
| Jamaicans | 0.0 /100 | #289 | Tragic 13.6% |
| Immigrants | Central America | 0.0 /100 | #290 | Tragic 13.6% |
| Blacks/African Americans | 0.0 /100 | #291 | Tragic 13.7% |
| Spanish American Indians | 0.0 /100 | #292 | Tragic 13.8% |
Demographics Similar to Arapaho by Seniors Poverty Over the Age of 65
In terms of seniors poverty over the age of 65, the demographic groups most similar to Arapaho are Immigrants from Ukraine (11.6%, a difference of 0.18%), Immigrants from Africa (11.6%, a difference of 0.45%), Peruvian (11.7%, a difference of 0.48%), Argentinean (11.7%, a difference of 0.55%), and Immigrants from Morocco (11.6%, a difference of 0.59%).
| Demographics | Rating | Rank | Seniors Poverty Over the Age of 65 |
| Immigrants | China | 9.5 /100 | #212 | Tragic 11.5% |
| Nepalese | 8.9 /100 | #213 | Tragic 11.5% |
| Immigrants | Russia | 8.8 /100 | #214 | Tragic 11.5% |
| French American Indians | 8.7 /100 | #215 | Tragic 11.5% |
| Immigrants | Morocco | 6.8 /100 | #216 | Tragic 11.6% |
| Immigrants | Africa | 6.4 /100 | #217 | Tragic 11.6% |
| Immigrants | Ukraine | 5.7 /100 | #218 | Tragic 11.6% |
| Arapaho | 5.2 /100 | #219 | Tragic 11.6% |
| Peruvians | 4.2 /100 | #220 | Tragic 11.7% |
| Argentineans | 4.1 /100 | #221 | Tragic 11.7% |
| Immigrants | Chile | 3.9 /100 | #222 | Tragic 11.7% |
| Immigrants | Congo | 3.8 /100 | #223 | Tragic 11.7% |
| Immigrants | Nigeria | 3.4 /100 | #224 | Tragic 11.7% |
| Immigrants | Belarus | 3.2 /100 | #225 | Tragic 11.8% |
| Liberians | 3.2 /100 | #226 | Tragic 11.8% |