Guatemalan vs Alaska Native Female Poverty Among 25-34 Year Olds
COMPARE
Guatemalan
Alaska Native
Female Poverty Among 25-34 Year Olds
Female Poverty Among 25-34 Year Olds Comparison
Guatemalans
Alaska Natives
16.4%
FEMALE POVERTY AMONG 25-34 YEAR OLDS
0.0/ 100
METRIC RATING
288th/ 347
METRIC RANK
16.8%
FEMALE POVERTY AMONG 25-34 YEAR OLDS
0.0/ 100
METRIC RATING
302nd/ 347
METRIC RANK
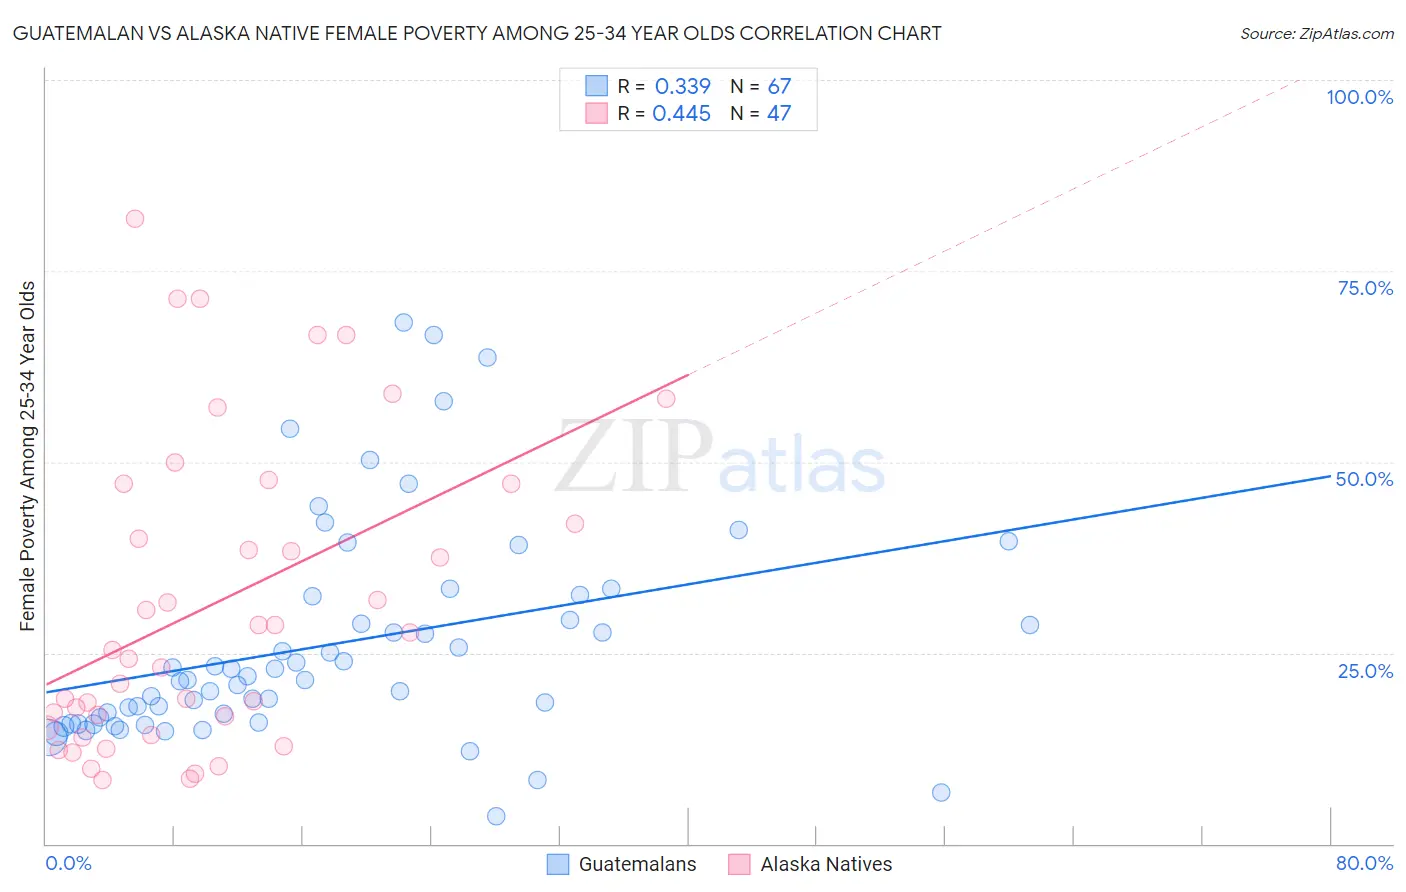
Guatemalan vs Alaska Native Female Poverty Among 25-34 Year Olds Correlation Chart
The statistical analysis conducted on geographies consisting of 404,378,710 people shows a mild positive correlation between the proportion of Guatemalans and poverty level among females between the ages 25 and 34 in the United States with a correlation coefficient (R) of 0.339 and weighted average of 16.4%. Similarly, the statistical analysis conducted on geographies consisting of 76,506,826 people shows a moderate positive correlation between the proportion of Alaska Natives and poverty level among females between the ages 25 and 34 in the United States with a correlation coefficient (R) of 0.445 and weighted average of 16.8%, a difference of 2.3%.
Female Poverty Among 25-34 Year Olds Correlation Summary
| Measurement | Guatemalan | Alaska Native |
| Minimum | 3.7% | 8.3% |
| Maximum | 68.3% | 81.8% |
| Range | 64.6% | 73.5% |
| Mean | 26.0% | 31.4% |
| Median | 21.5% | 25.4% |
| Interquartile 25% (IQ1) | 15.9% | 15.2% |
| Interquartile 75% (IQ3) | 32.4% | 47.1% |
| Interquartile Range (IQR) | 16.5% | 31.8% |
| Standard Deviation (Sample) | 14.1% | 20.0% |
| Standard Deviation (Population) | 14.0% | 19.8% |
Demographics Similar to Guatemalans and Alaska Natives by Female Poverty Among 25-34 Year Olds
In terms of female poverty among 25-34 year olds, the demographic groups most similar to Guatemalans are Osage (16.4%, a difference of 0.060%), American (16.4%, a difference of 0.19%), Indonesian (16.4%, a difference of 0.22%), Cape Verdean (16.3%, a difference of 0.24%), and Immigrants from Bahamas (16.3%, a difference of 0.42%). Similarly, the demographic groups most similar to Alaska Natives are Immigrants from Congo (16.7%, a difference of 0.11%), U.S. Virgin Islander (16.7%, a difference of 0.12%), Spanish American (16.7%, a difference of 0.27%), Blackfeet (16.7%, a difference of 0.31%), and Immigrants from Mexico (16.8%, a difference of 0.31%).
| Demographics | Rating | Rank | Female Poverty Among 25-34 Year Olds |
| Immigrants | Bahamas | 0.0 /100 | #285 | Tragic 16.3% |
| Cape Verdeans | 0.0 /100 | #286 | Tragic 16.3% |
| Americans | 0.0 /100 | #287 | Tragic 16.4% |
| Guatemalans | 0.0 /100 | #288 | Tragic 16.4% |
| Osage | 0.0 /100 | #289 | Tragic 16.4% |
| Indonesians | 0.0 /100 | #290 | Tragic 16.4% |
| Comanche | 0.0 /100 | #291 | Tragic 16.5% |
| Immigrants | Dominica | 0.0 /100 | #292 | Tragic 16.5% |
| Potawatomi | 0.0 /100 | #293 | Tragic 16.5% |
| Immigrants | Central America | 0.0 /100 | #294 | Tragic 16.6% |
| Mexicans | 0.0 /100 | #295 | Tragic 16.6% |
| Hispanics or Latinos | 0.0 /100 | #296 | Tragic 16.6% |
| Immigrants | Guatemala | 0.0 /100 | #297 | Tragic 16.6% |
| Blackfeet | 0.0 /100 | #298 | Tragic 16.7% |
| Spanish Americans | 0.0 /100 | #299 | Tragic 16.7% |
| U.S. Virgin Islanders | 0.0 /100 | #300 | Tragic 16.7% |
| Immigrants | Congo | 0.0 /100 | #301 | Tragic 16.7% |
| Alaska Natives | 0.0 /100 | #302 | Tragic 16.8% |
| Immigrants | Mexico | 0.0 /100 | #303 | Tragic 16.8% |
| Hondurans | 0.0 /100 | #304 | Tragic 16.9% |
| Immigrants | Cabo Verde | 0.0 /100 | #305 | Tragic 16.9% |