Guamanian/Chamorro vs Immigrants from Bolivia Single Father Poverty
COMPARE
Guamanian/Chamorro
Immigrants from Bolivia
Single Father Poverty
Single Father Poverty Comparison
Guamanians/Chamorros
Immigrants from Bolivia
15.1%
SINGLE FATHER POVERTY
99.9/ 100
METRIC RATING
59th/ 347
METRIC RANK
14.7%
SINGLE FATHER POVERTY
100.0/ 100
METRIC RATING
35th/ 347
METRIC RANK
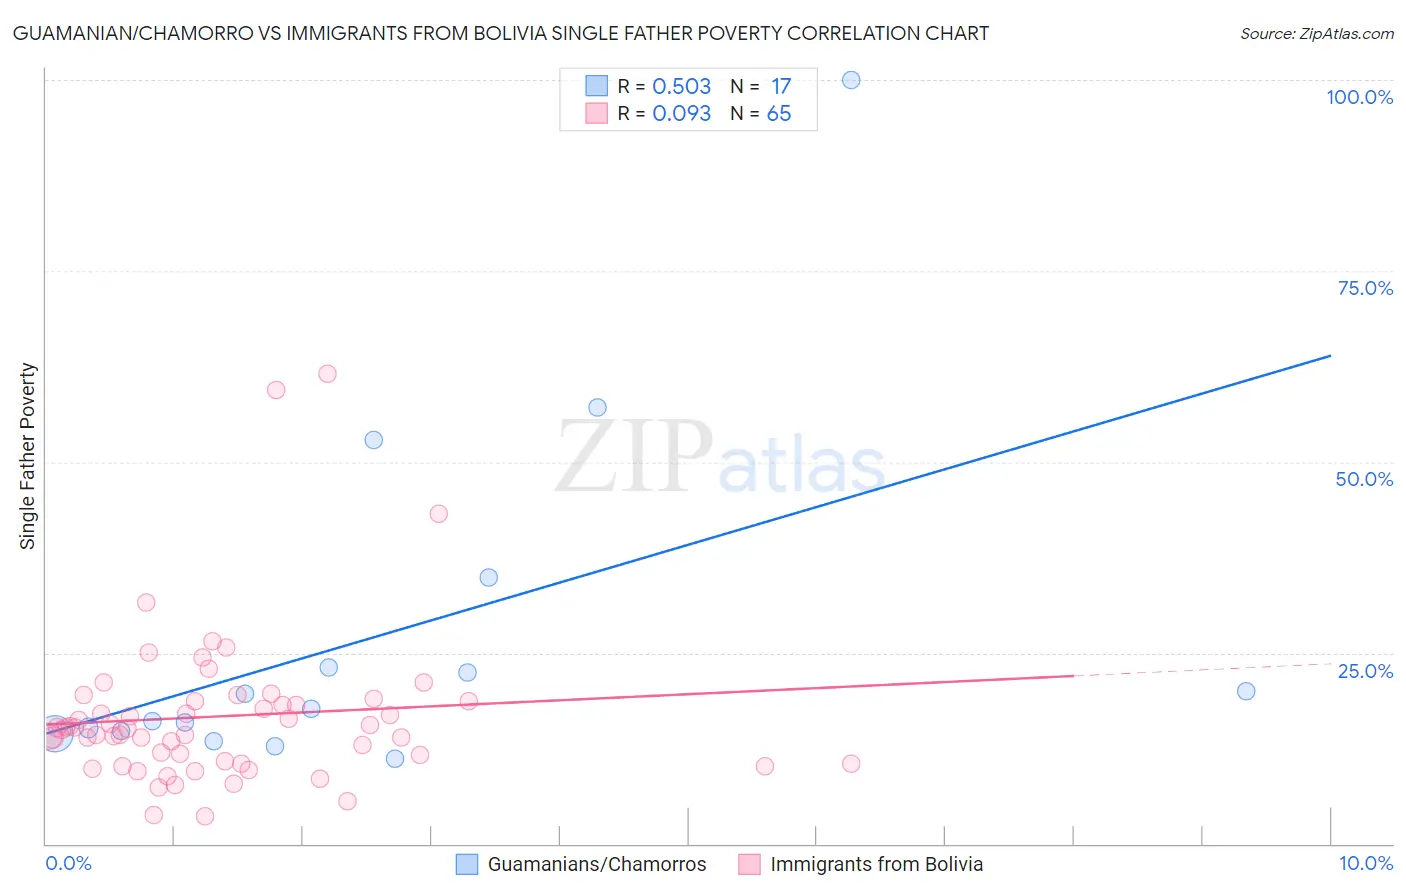
Guamanian/Chamorro vs Immigrants from Bolivia Single Father Poverty Correlation Chart
The statistical analysis conducted on geographies consisting of 191,371,634 people shows a substantial positive correlation between the proportion of Guamanians/Chamorros and poverty level among single fathers in the United States with a correlation coefficient (R) of 0.503 and weighted average of 15.1%. Similarly, the statistical analysis conducted on geographies consisting of 137,322,784 people shows a slight positive correlation between the proportion of Immigrants from Bolivia and poverty level among single fathers in the United States with a correlation coefficient (R) of 0.093 and weighted average of 14.7%, a difference of 2.9%.
Single Father Poverty Correlation Summary
| Measurement | Guamanian/Chamorro | Immigrants from Bolivia |
| Minimum | 11.2% | 3.6% |
| Maximum | 100.0% | 61.5% |
| Range | 88.8% | 58.0% |
| Mean | 27.1% | 16.7% |
| Median | 17.6% | 15.0% |
| Interquartile 25% (IQ1) | 14.6% | 10.6% |
| Interquartile 75% (IQ3) | 29.0% | 18.6% |
| Interquartile Range (IQR) | 14.4% | 8.0% |
| Standard Deviation (Sample) | 23.1% | 10.2% |
| Standard Deviation (Population) | 22.4% | 10.1% |
Similar Demographics by Single Father Poverty
Demographics Similar to Guamanians/Chamorros by Single Father Poverty
In terms of single father poverty, the demographic groups most similar to Guamanians/Chamorros are Hawaiian (15.1%, a difference of 0.10%), Laotian (15.1%, a difference of 0.15%), Immigrants from Laos (15.1%, a difference of 0.24%), Puget Sound Salish (15.2%, a difference of 0.40%), and Immigrants from Bosnia and Herzegovina (15.2%, a difference of 0.45%).
| Demographics | Rating | Rank | Single Father Poverty |
| Immigrants | El Salvador | 99.9 /100 | #52 | Exceptional 15.0% |
| Immigrants | Kenya | 99.9 /100 | #53 | Exceptional 15.0% |
| Immigrants | Uzbekistan | 99.9 /100 | #54 | Exceptional 15.0% |
| Immigrants | Bulgaria | 99.9 /100 | #55 | Exceptional 15.0% |
| Immigrants | Laos | 99.9 /100 | #56 | Exceptional 15.1% |
| Laotians | 99.9 /100 | #57 | Exceptional 15.1% |
| Hawaiians | 99.9 /100 | #58 | Exceptional 15.1% |
| Guamanians/Chamorros | 99.9 /100 | #59 | Exceptional 15.1% |
| Puget Sound Salish | 99.8 /100 | #60 | Exceptional 15.2% |
| Immigrants | Bosnia and Herzegovina | 99.8 /100 | #61 | Exceptional 15.2% |
| Immigrants | Armenia | 99.8 /100 | #62 | Exceptional 15.2% |
| Immigrants | Sweden | 99.8 /100 | #63 | Exceptional 15.2% |
| Bangladeshis | 99.8 /100 | #64 | Exceptional 15.2% |
| Immigrants | Malaysia | 99.8 /100 | #65 | Exceptional 15.2% |
| Immigrants | Moldova | 99.8 /100 | #66 | Exceptional 15.2% |
Demographics Similar to Immigrants from Bolivia by Single Father Poverty
In terms of single father poverty, the demographic groups most similar to Immigrants from Bolivia are Egyptian (14.7%, a difference of 0.070%), Okinawan (14.6%, a difference of 0.17%), Immigrants from Indonesia (14.7%, a difference of 0.17%), Immigrants from Eastern Africa (14.7%, a difference of 0.29%), and Bolivian (14.7%, a difference of 0.30%).
| Demographics | Rating | Rank | Single Father Poverty |
| Immigrants | South Central Asia | 100.0 /100 | #28 | Exceptional 14.5% |
| Somalis | 100.0 /100 | #29 | Exceptional 14.5% |
| Thais | 100.0 /100 | #30 | Exceptional 14.5% |
| Icelanders | 100.0 /100 | #31 | Exceptional 14.5% |
| Asians | 100.0 /100 | #32 | Exceptional 14.6% |
| Okinawans | 100.0 /100 | #33 | Exceptional 14.6% |
| Egyptians | 100.0 /100 | #34 | Exceptional 14.7% |
| Immigrants | Bolivia | 100.0 /100 | #35 | Exceptional 14.7% |
| Immigrants | Indonesia | 100.0 /100 | #36 | Exceptional 14.7% |
| Immigrants | Eastern Africa | 100.0 /100 | #37 | Exceptional 14.7% |
| Bolivians | 100.0 /100 | #38 | Exceptional 14.7% |
| Immigrants | Asia | 100.0 /100 | #39 | Exceptional 14.7% |
| Pima | 100.0 /100 | #40 | Exceptional 14.8% |
| Indians (Asian) | 100.0 /100 | #41 | Exceptional 14.8% |
| Immigrants | Nepal | 100.0 /100 | #42 | Exceptional 14.8% |