Guamanian/Chamorro vs Icelander Female Poverty Among 18-24 Year Olds
COMPARE
Guamanian/Chamorro
Icelander
Female Poverty Among 18-24 Year Olds
Female Poverty Among 18-24 Year Olds Comparison
Guamanians/Chamorros
Icelanders
19.0%
FEMALE POVERTY AMONG 18-24 YEAR OLDS
98.8/ 100
METRIC RATING
95th/ 347
METRIC RANK
21.5%
FEMALE POVERTY AMONG 18-24 YEAR OLDS
0.3/ 100
METRIC RATING
263rd/ 347
METRIC RANK
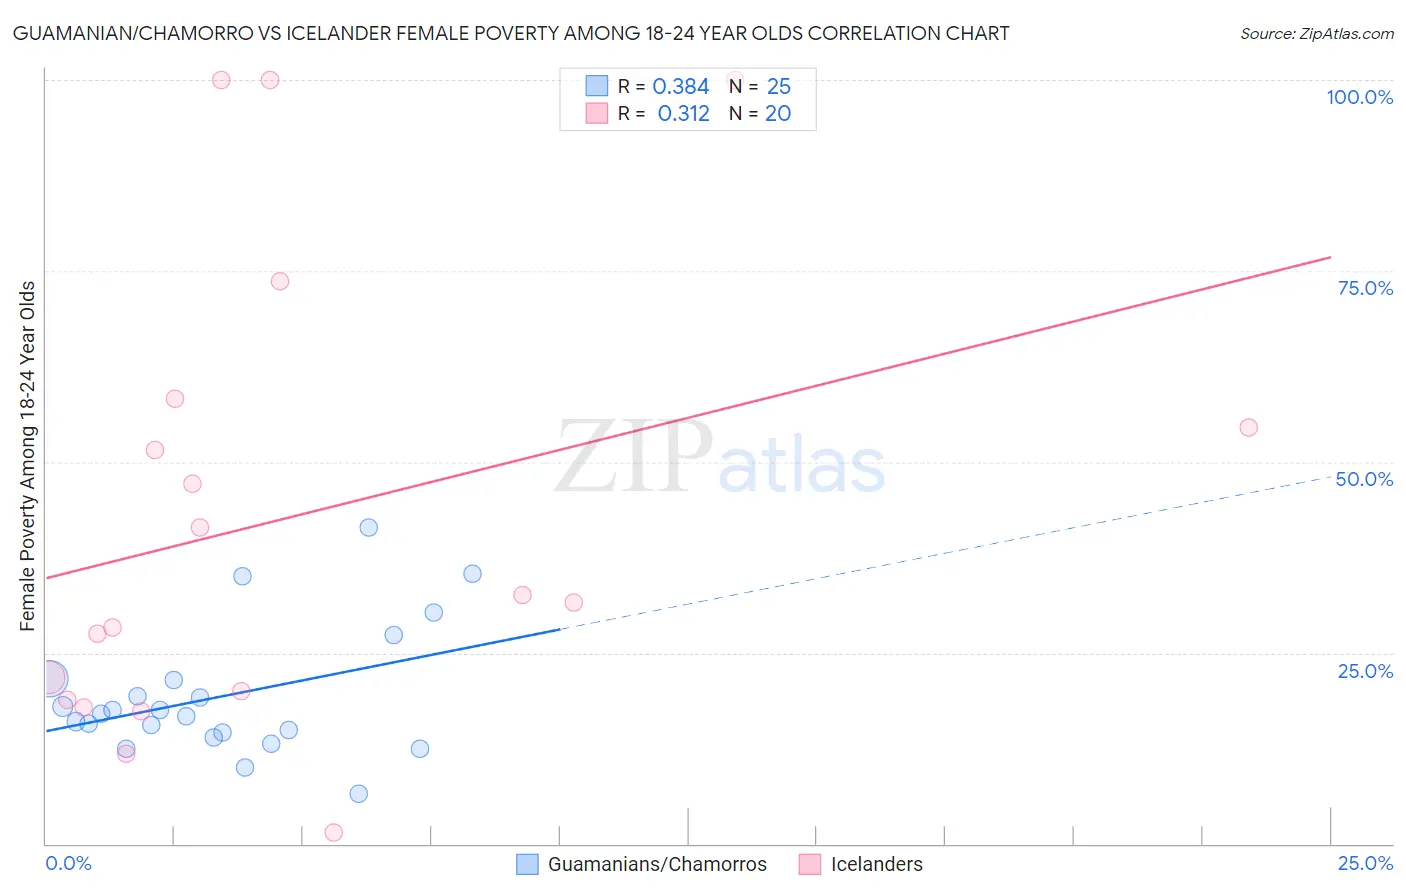
Guamanian/Chamorro vs Icelander Female Poverty Among 18-24 Year Olds Correlation Chart
The statistical analysis conducted on geographies consisting of 219,657,100 people shows a mild positive correlation between the proportion of Guamanians/Chamorros and poverty level among females between the ages 18 and 24 in the United States with a correlation coefficient (R) of 0.384 and weighted average of 19.0%. Similarly, the statistical analysis conducted on geographies consisting of 157,989,488 people shows a mild positive correlation between the proportion of Icelanders and poverty level among females between the ages 18 and 24 in the United States with a correlation coefficient (R) of 0.312 and weighted average of 21.5%, a difference of 13.1%.
Female Poverty Among 18-24 Year Olds Correlation Summary
| Measurement | Guamanian/Chamorro | Icelander |
| Minimum | 6.5% | 1.5% |
| Maximum | 41.5% | 100.0% |
| Range | 34.9% | 98.5% |
| Mean | 19.3% | 42.8% |
| Median | 17.0% | 32.1% |
| Interquartile 25% (IQ1) | 14.3% | 19.4% |
| Interquartile 75% (IQ3) | 21.5% | 56.4% |
| Interquartile Range (IQR) | 7.2% | 37.0% |
| Standard Deviation (Sample) | 8.4% | 30.3% |
| Standard Deviation (Population) | 8.3% | 29.5% |
Similar Demographics by Female Poverty Among 18-24 Year Olds
Demographics Similar to Guamanians/Chamorros by Female Poverty Among 18-24 Year Olds
In terms of female poverty among 18-24 year olds, the demographic groups most similar to Guamanians/Chamorros are Ukrainian (19.0%, a difference of 0.070%), Sierra Leonean (19.0%, a difference of 0.10%), Haitian (19.0%, a difference of 0.13%), Filipino (19.0%, a difference of 0.16%), and Romanian (19.0%, a difference of 0.20%).
| Demographics | Rating | Rank | Female Poverty Among 18-24 Year Olds |
| Croatians | 99.1 /100 | #88 | Exceptional 19.0% |
| Immigrants | Cabo Verde | 99.0 /100 | #89 | Exceptional 19.0% |
| Afghans | 99.0 /100 | #90 | Exceptional 19.0% |
| Romanians | 98.9 /100 | #91 | Exceptional 19.0% |
| Filipinos | 98.9 /100 | #92 | Exceptional 19.0% |
| Haitians | 98.9 /100 | #93 | Exceptional 19.0% |
| Ukrainians | 98.8 /100 | #94 | Exceptional 19.0% |
| Guamanians/Chamorros | 98.8 /100 | #95 | Exceptional 19.0% |
| Sierra Leoneans | 98.7 /100 | #96 | Exceptional 19.0% |
| Salvadorans | 98.4 /100 | #97 | Exceptional 19.1% |
| Immigrants | Jordan | 98.4 /100 | #98 | Exceptional 19.1% |
| Immigrants | Czechoslovakia | 98.3 /100 | #99 | Exceptional 19.1% |
| Chileans | 98.3 /100 | #100 | Exceptional 19.1% |
| Ecuadorians | 98.1 /100 | #101 | Exceptional 19.1% |
| Immigrants | Caribbean | 98.1 /100 | #102 | Exceptional 19.1% |
Demographics Similar to Icelanders by Female Poverty Among 18-24 Year Olds
In terms of female poverty among 18-24 year olds, the demographic groups most similar to Icelanders are Honduran (21.5%, a difference of 0.050%), Nonimmigrants (21.5%, a difference of 0.060%), Alaska Native (21.5%, a difference of 0.13%), American (21.6%, a difference of 0.21%), and Immigrants from Eastern Africa (21.4%, a difference of 0.35%).
| Demographics | Rating | Rank | Female Poverty Among 18-24 Year Olds |
| Tsimshian | 1.0 /100 | #256 | Tragic 21.2% |
| Taiwanese | 1.0 /100 | #257 | Tragic 21.2% |
| Vietnamese | 0.6 /100 | #258 | Tragic 21.4% |
| Immigrants | France | 0.6 /100 | #259 | Tragic 21.4% |
| Immigrants | Norway | 0.6 /100 | #260 | Tragic 21.4% |
| Immigrants | Bahamas | 0.5 /100 | #261 | Tragic 21.4% |
| Immigrants | Eastern Africa | 0.4 /100 | #262 | Tragic 21.4% |
| Icelanders | 0.3 /100 | #263 | Tragic 21.5% |
| Hondurans | 0.3 /100 | #264 | Tragic 21.5% |
| Immigrants | Nonimmigrants | 0.3 /100 | #265 | Tragic 21.5% |
| Alaska Natives | 0.3 /100 | #266 | Tragic 21.5% |
| Americans | 0.3 /100 | #267 | Tragic 21.6% |
| Immigrants | Burma/Myanmar | 0.2 /100 | #268 | Tragic 21.6% |
| Celtics | 0.2 /100 | #269 | Tragic 21.6% |
| Mongolians | 0.2 /100 | #270 | Tragic 21.6% |