Ghanaian vs Costa Rican Female Poverty
COMPARE
Ghanaian
Costa Rican
Female Poverty
Female Poverty Comparison
Ghanaians
Costa Ricans
14.7%
FEMALE POVERTY
1.9/ 100
METRIC RATING
229th/ 347
METRIC RANK
13.3%
FEMALE POVERTY
63.6/ 100
METRIC RATING
159th/ 347
METRIC RANK
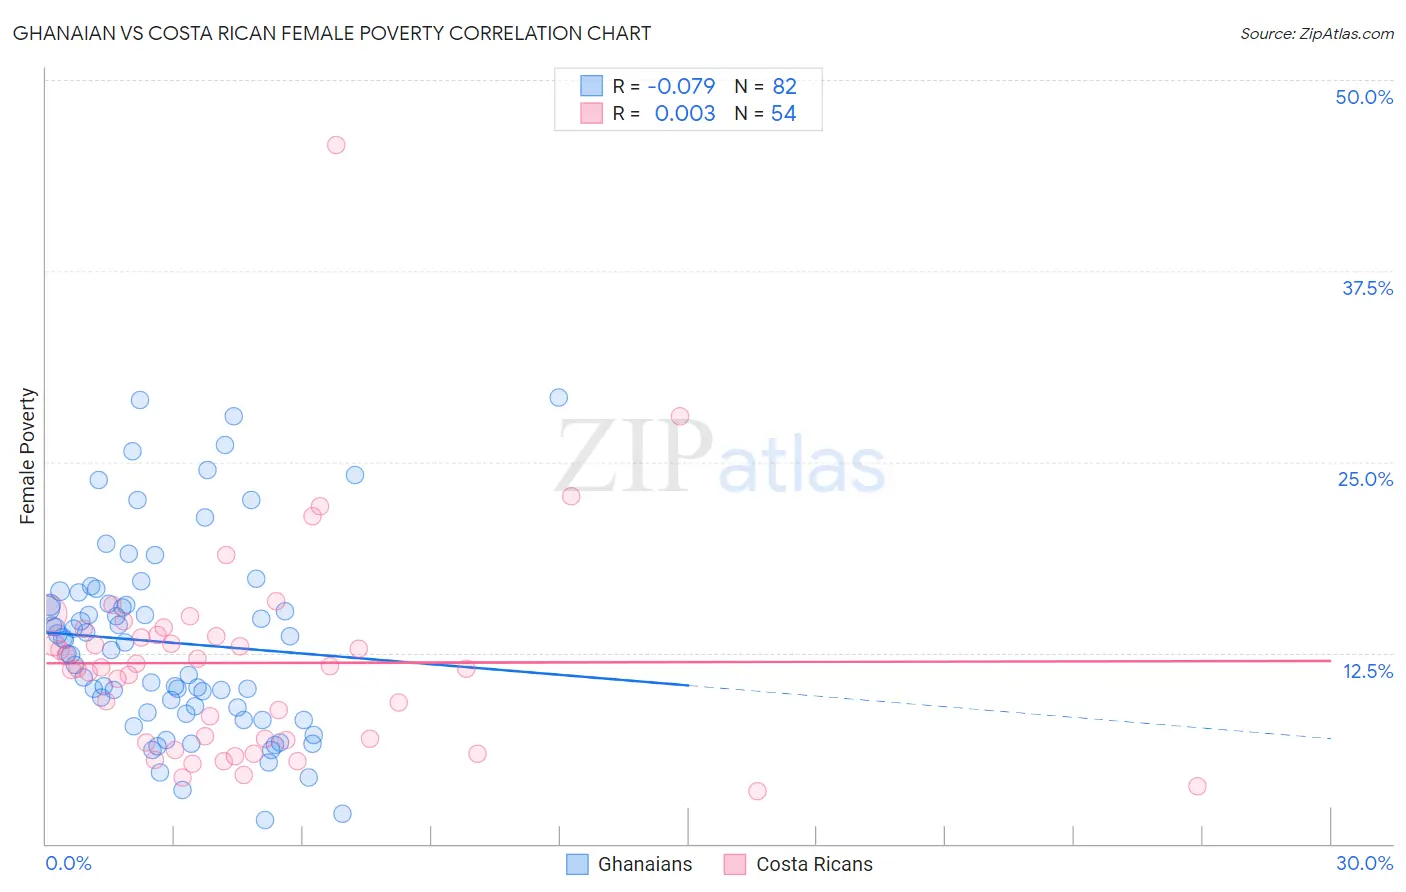
Ghanaian vs Costa Rican Female Poverty Correlation Chart
The statistical analysis conducted on geographies consisting of 190,346,829 people shows a slight negative correlation between the proportion of Ghanaians and poverty level among females in the United States with a correlation coefficient (R) of -0.079 and weighted average of 14.7%. Similarly, the statistical analysis conducted on geographies consisting of 253,437,784 people shows no correlation between the proportion of Costa Ricans and poverty level among females in the United States with a correlation coefficient (R) of 0.003 and weighted average of 13.3%, a difference of 11.0%.
Female Poverty Correlation Summary
| Measurement | Ghanaian | Costa Rican |
| Minimum | 1.5% | 3.4% |
| Maximum | 29.2% | 45.8% |
| Range | 27.7% | 42.4% |
| Mean | 13.2% | 11.8% |
| Median | 12.9% | 11.5% |
| Interquartile 25% (IQ1) | 8.6% | 6.8% |
| Interquartile 75% (IQ3) | 15.7% | 13.6% |
| Interquartile Range (IQR) | 7.1% | 6.8% |
| Standard Deviation (Sample) | 6.3% | 7.0% |
| Standard Deviation (Population) | 6.2% | 6.9% |
Similar Demographics by Female Poverty
Demographics Similar to Ghanaians by Female Poverty
In terms of female poverty, the demographic groups most similar to Ghanaians are German Russian (14.7%, a difference of 0.060%), Alaska Native (14.7%, a difference of 0.20%), Immigrants from Nigeria (14.7%, a difference of 0.21%), Nigerian (14.8%, a difference of 0.30%), and Immigrants from Eritrea (14.6%, a difference of 0.52%).
| Demographics | Rating | Rank | Female Poverty |
| Immigrants | Nonimmigrants | 3.7 /100 | #222 | Tragic 14.5% |
| Immigrants | Africa | 3.3 /100 | #223 | Tragic 14.5% |
| Americans | 2.8 /100 | #224 | Tragic 14.6% |
| Immigrants | Micronesia | 2.8 /100 | #225 | Tragic 14.6% |
| Immigrants | Eritrea | 2.4 /100 | #226 | Tragic 14.6% |
| Immigrants | Nigeria | 2.1 /100 | #227 | Tragic 14.7% |
| German Russians | 2.0 /100 | #228 | Tragic 14.7% |
| Ghanaians | 1.9 /100 | #229 | Tragic 14.7% |
| Alaska Natives | 1.8 /100 | #230 | Tragic 14.7% |
| Nigerians | 1.7 /100 | #231 | Tragic 14.8% |
| Osage | 1.5 /100 | #232 | Tragic 14.8% |
| Immigrants | Saudi Arabia | 1.4 /100 | #233 | Tragic 14.8% |
| Fijians | 1.1 /100 | #234 | Tragic 14.9% |
| Immigrants | Laos | 0.9 /100 | #235 | Tragic 15.0% |
| Cree | 0.7 /100 | #236 | Tragic 15.1% |
Demographics Similar to Costa Ricans by Female Poverty
In terms of female poverty, the demographic groups most similar to Costa Ricans are Immigrants from Nepal (13.3%, a difference of 0.090%), Immigrants from Ethiopia (13.3%, a difference of 0.12%), Guamanian/Chamorro (13.3%, a difference of 0.12%), Immigrants from Albania (13.3%, a difference of 0.13%), and Ethiopian (13.3%, a difference of 0.14%).
| Demographics | Rating | Rank | Female Poverty |
| Samoans | 73.6 /100 | #152 | Good 13.1% |
| Immigrants | Fiji | 71.0 /100 | #153 | Good 13.2% |
| Armenians | 70.4 /100 | #154 | Good 13.2% |
| Hungarians | 70.1 /100 | #155 | Good 13.2% |
| Immigrants | Bosnia and Herzegovina | 69.7 /100 | #156 | Good 13.2% |
| Immigrants | Northern Africa | 68.8 /100 | #157 | Good 13.2% |
| Pennsylvania Germans | 67.3 /100 | #158 | Good 13.2% |
| Costa Ricans | 63.6 /100 | #159 | Good 13.3% |
| Immigrants | Nepal | 62.7 /100 | #160 | Good 13.3% |
| Immigrants | Ethiopia | 62.5 /100 | #161 | Good 13.3% |
| Guamanians/Chamorros | 62.4 /100 | #162 | Good 13.3% |
| Immigrants | Albania | 62.4 /100 | #163 | Good 13.3% |
| Ethiopians | 62.3 /100 | #164 | Good 13.3% |
| Scotch-Irish | 62.1 /100 | #165 | Good 13.3% |
| Immigrants | Oceania | 59.7 /100 | #166 | Average 13.3% |