German vs Immigrants from Portugal Single Female Poverty
COMPARE
German
Immigrants from Portugal
Single Female Poverty
Single Female Poverty Comparison
Germans
Immigrants from Portugal
21.8%
SINGLE FEMALE POVERTY
8.3/ 100
METRIC RATING
220th/ 347
METRIC RANK
21.9%
SINGLE FEMALE POVERTY
5.8/ 100
METRIC RATING
226th/ 347
METRIC RANK
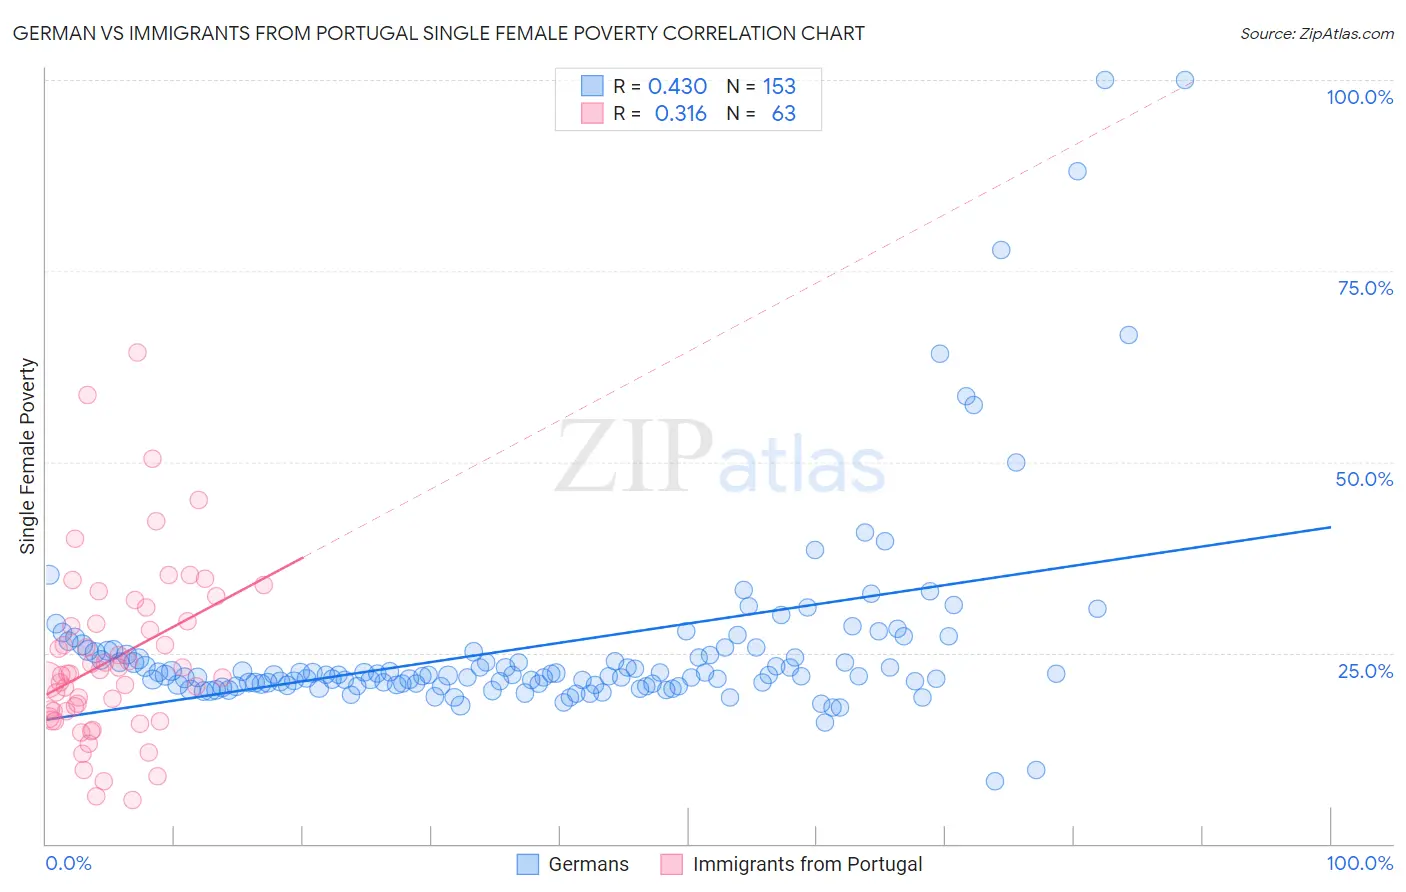
German vs Immigrants from Portugal Single Female Poverty Correlation Chart
The statistical analysis conducted on geographies consisting of 558,181,228 people shows a moderate positive correlation between the proportion of Germans and poverty level among single females in the United States with a correlation coefficient (R) of 0.430 and weighted average of 21.8%. Similarly, the statistical analysis conducted on geographies consisting of 172,894,894 people shows a mild positive correlation between the proportion of Immigrants from Portugal and poverty level among single females in the United States with a correlation coefficient (R) of 0.316 and weighted average of 21.9%, a difference of 0.57%.
Single Female Poverty Correlation Summary
| Measurement | German | Immigrants from Portugal |
| Minimum | 8.2% | 5.7% |
| Maximum | 100.0% | 64.3% |
| Range | 91.8% | 58.6% |
| Mean | 26.0% | 24.2% |
| Median | 22.1% | 22.2% |
| Interquartile 25% (IQ1) | 20.8% | 16.5% |
| Interquartile 75% (IQ3) | 25.2% | 29.1% |
| Interquartile Range (IQR) | 4.3% | 12.6% |
| Standard Deviation (Sample) | 13.4% | 11.5% |
| Standard Deviation (Population) | 13.4% | 11.4% |
Demographics Similar to Germans and Immigrants from Portugal by Single Female Poverty
In terms of single female poverty, the demographic groups most similar to Germans are Immigrants from Grenada (21.8%, a difference of 0.050%), Immigrants from Eritrea (21.8%, a difference of 0.070%), Panamanian (21.7%, a difference of 0.21%), Scottish (21.8%, a difference of 0.21%), and Barbadian (21.8%, a difference of 0.23%). Similarly, the demographic groups most similar to Immigrants from Portugal are Immigrants from Ghana (21.9%, a difference of 0.0%), Salvadoran (21.9%, a difference of 0.10%), Tlingit-Haida (21.9%, a difference of 0.13%), Immigrants from Western Africa (22.0%, a difference of 0.15%), and English (21.9%, a difference of 0.16%).
| Demographics | Rating | Rank | Single Female Poverty |
| Guamanians/Chamorros | 13.7 /100 | #213 | Poor 21.6% |
| Immigrants | Nicaragua | 13.3 /100 | #214 | Poor 21.6% |
| Ecuadorians | 12.3 /100 | #215 | Poor 21.6% |
| Immigrants | Barbados | 12.2 /100 | #216 | Poor 21.7% |
| Immigrants | St. Vincent and the Grenadines | 11.7 /100 | #217 | Poor 21.7% |
| Nepalese | 9.7 /100 | #218 | Tragic 21.7% |
| Panamanians | 9.4 /100 | #219 | Tragic 21.7% |
| Germans | 8.3 /100 | #220 | Tragic 21.8% |
| Immigrants | Grenada | 8.0 /100 | #221 | Tragic 21.8% |
| Immigrants | Eritrea | 7.9 /100 | #222 | Tragic 21.8% |
| Scottish | 7.3 /100 | #223 | Tragic 21.8% |
| Barbadians | 7.2 /100 | #224 | Tragic 21.8% |
| English | 6.4 /100 | #225 | Tragic 21.9% |
| Immigrants | Portugal | 5.8 /100 | #226 | Tragic 21.9% |
| Immigrants | Ghana | 5.8 /100 | #227 | Tragic 21.9% |
| Salvadorans | 5.5 /100 | #228 | Tragic 21.9% |
| Tlingit-Haida | 5.4 /100 | #229 | Tragic 21.9% |
| Immigrants | Western Africa | 5.3 /100 | #230 | Tragic 22.0% |
| Welsh | 5.0 /100 | #231 | Tragic 22.0% |
| Immigrants | Thailand | 5.0 /100 | #232 | Tragic 22.0% |
| Spaniards | 4.7 /100 | #233 | Tragic 22.0% |