German vs Immigrants from Moldova Single Father Poverty

COMPARE

German
Race
Ancestry
AfghanAfricanAlaska NativeAlaskan AthabascanAlbanianAleutAlsatianAmericanApacheArabArapahoArgentineanArmenianAssyrian/Chaldean/SyriacAustralianAustrianBahamianBangladeshiBarbadianBasqueBelgianBelizeanBermudanBhutaneseBlackfeetBolivianBrazilianBritishBritish West IndianBulgarianBurmeseCajunCambodianCanadianCape VerdeanCarpatho RusynCelticCentral AmericanCentral American IndianCherokeeCheyenneChickasawChileanChineseChippewaChoctawColombianColvilleComancheCosta RicanCreeCreekCroatianCrowCubanCypriotCzechCzechoslovakianDanishDelawareDominicanDutchDutch West IndianEastern EuropeanEcuadorianEgyptianEnglishEstonianEthiopianEuropeanFijianFilipinoFinnishFrenchFrench American IndianFrench CanadianGermanGerman RussianGhanaianGreekGuamanian/ChamorroGuatemalanGuyaneseHaitianHmongHonduranHopiHoumaHungarianIcelanderIndian (Asian)IndonesianInupiatIranianIraqiIrishIroquoisIsraeliItalianJamaicanJapaneseJordanianKenyanKiowaKoreanLaotianLatvianLebaneseLiberianLithuanianLumbeeLuxembourgerMacedonianMalaysianMalteseMarshalleseMenomineeMexicanMexican American IndianMongolianMoroccanNative HawaiianNavajoNepaleseNew ZealanderNicaraguanNigerianNorthern EuropeanNorwegianOkinawanOsageOttawaPaiutePakistaniPalestinianPanamanianParaguayanPennsylvania GermanPeruvianPimaPolishPortuguesePotawatomiPuebloPuerto RicanPuget Sound SalishRomanianRussianSalvadoranSamoanScandinavianScotch-IrishScottishSeminoleSenegaleseSerbianShoshoneSierra LeoneanSiouxSlavicSlovakSloveneSomaliSouth AfricanSouth AmericanSouth American IndianSoviet UnionSpaniardSpanishSpanish AmericanSpanish American IndianSri LankanSubsaharan AfricanSudaneseSwedishSwissSyrianTaiwaneseThaiTlingit-HaidaTohono O'OdhamTonganTrinidadian and TobagonianTsimshianTurkishU.S. Virgin IslanderUgandanUkrainianUruguayanUteVenezuelanVietnameseWelshWest IndianYakamaYaquiYugoslavianYumanYup'ikZimbabwean
Immigration
NonimmigrantsImmigrantsAfghanistanAfricaAlbaniaArgentinaArmeniaAsiaAustraliaAustriaBahamasBangladeshBarbadosBelarusBelgiumBelizeBoliviaBosnia and HerzegovinaBrazilBulgariaBurma/MyanmarCabo VerdeCambodiaCameroonCanadaCaribbeanCentral AmericaChileChinaColombiaCongoCosta RicaCroatiaCubaCzechoslovakiaDenmarkDominicaDominican RepublicEastern AfricaEastern AsiaEastern EuropeEcuadorEgyptEl SalvadorEnglandEritreaEthiopiaEuropeFijiFranceGermanyGhanaGreeceGrenadaGuatemalaGuyanaHaitiHondurasHong KongHungaryIndiaIndonesiaIranIraqIrelandIsraelItalyJamaicaJapanJordanKazakhstanKenyaKoreaKuwaitLaosLatin AmericaLatviaLebanonLiberiaLithuaniaMalaysiaMexicoMicronesiaMiddle AfricaMoroccoNepalNetherlandsNicaraguaNigeriaNorth AmericaNorth MacedoniaNorthern AfricaNorthern EuropeNorwayOceaniaPakistanPanamaPeruPhilippinesPolandPortugalRomaniaRussiaSaudi ArabiaScotlandSenegalSerbiaSierra LeoneSingaporeSomaliaSouth AfricaSouth AmericaSouth Central AsiaSouth Eastern AsiaSouthern EuropeSpainSri LankaSt. Vincent and the GrenadinesSudanSwedenSwitzerlandSyriaTaiwanThailandTrinidad and TobagoTurkeyUgandaUkraineUruguayUzbekistanVenezuelaVietnamWest IndiesWestern AfricaWestern AsiaWestern EuropeYemenZaireZimbabweAzores
Immigrants from Moldova
Race
Ancestry
AfghanAfricanAlaska NativeAlaskan AthabascanAlbanianAleutAlsatianAmericanApacheArabArapahoArgentineanArmenianAssyrian/Chaldean/SyriacAustralianAustrianBahamianBangladeshiBarbadianBasqueBelgianBelizeanBermudanBhutaneseBlackfeetBolivianBrazilianBritishBritish West IndianBulgarianBurmeseCajunCambodianCanadianCape VerdeanCarpatho RusynCelticCentral AmericanCentral American IndianCherokeeCheyenneChickasawChileanChineseChippewaChoctawColombianColvilleComancheCosta RicanCreeCreekCroatianCrowCubanCypriotCzechCzechoslovakianDanishDelawareDominicanDutchDutch West IndianEastern EuropeanEcuadorianEgyptianEnglishEstonianEthiopianEuropeanFijianFilipinoFinnishFrenchFrench American IndianFrench CanadianGerman RussianGhanaianGreekGuamanian/ChamorroGuatemalanGuyaneseHaitianHmongHonduranHopiHoumaHungarianIcelanderIndian (Asian)IndonesianInupiatIranianIraqiIrishIroquoisIsraeliItalianJamaicanJapaneseJordanianKenyanKiowaKoreanLaotianLatvianLebaneseLiberianLithuanianLumbeeLuxembourgerMacedonianMalaysianMalteseMarshalleseMenomineeMexicanMexican American IndianMongolianMoroccanNative HawaiianNavajoNepaleseNew ZealanderNicaraguanNigerianNorthern EuropeanNorwegianOkinawanOsageOttawaPaiutePakistaniPalestinianPanamanianParaguayanPennsylvania GermanPeruvianPimaPolishPortuguesePotawatomiPuebloPuerto RicanPuget Sound SalishRomanianRussianSalvadoranSamoanScandinavianScotch-IrishScottishSeminoleSenegaleseSerbianShoshoneSierra LeoneanSiouxSlavicSlovakSloveneSomaliSouth AfricanSouth AmericanSouth American IndianSoviet UnionSpaniardSpanishSpanish AmericanSpanish American IndianSri LankanSubsaharan AfricanSudaneseSwedishSwissSyrianTaiwaneseThaiTlingit-HaidaTohono O'OdhamTonganTrinidadian and TobagonianTsimshianTurkishU.S. Virgin IslanderUgandanUkrainianUruguayanUteVenezuelanVietnameseWelshWest IndianYakamaYaquiYugoslavianYumanYup'ikZimbabwean
Immigration
NonimmigrantsImmigrantsAfghanistanAfricaAlbaniaArgentinaArmeniaAsiaAustraliaAustriaBahamasBangladeshBarbadosBelarusBelgiumBelizeBoliviaBosnia and HerzegovinaBrazilBulgariaBurma/MyanmarCabo VerdeCambodiaCameroonCanadaCaribbeanCentral AmericaChileChinaColombiaCongoCosta RicaCroatiaCubaCzechoslovakiaDenmarkDominicaDominican RepublicEastern AfricaEastern AsiaEastern EuropeEcuadorEgyptEl SalvadorEnglandEritreaEthiopiaEuropeFijiFranceGermanyGhanaGreeceGrenadaGuatemalaGuyanaHaitiHondurasHong KongHungaryIndiaIndonesiaIranIraqIrelandIsraelItalyJamaicaJapanJordanKazakhstanKenyaKoreaKuwaitLaosLatin AmericaLatviaLebanonLiberiaLithuaniaMalaysiaMexicoMicronesiaMiddle AfricaMoldovaMoroccoNepalNetherlandsNicaraguaNigeriaNorth AmericaNorth MacedoniaNorthern AfricaNorthern EuropeNorwayOceaniaPakistanPanamaPeruPhilippinesPolandPortugalRomaniaRussiaSaudi ArabiaScotlandSenegalSerbiaSierra LeoneSingaporeSomaliaSouth AfricaSouth AmericaSouth Central AsiaSouth Eastern AsiaSouthern EuropeSpainSri LankaSt. Vincent and the GrenadinesSudanSwedenSwitzerlandSyriaTaiwanThailandTrinidad and TobagoTurkeyUgandaUkraineUruguayUzbekistanVenezuelaVietnamWest IndiesWestern AfricaWestern AsiaWestern EuropeYemenZaireZimbabweAzores
Single Father Poverty
Income
Poverty
Unemployment
Labor Participation
Family Structure
Vehicle Availability
Education Level
Disability

Single Father Poverty Comparison

Germans

Immigrants from Moldova

Tragic
Exceptional
17.7%
SINGLE FATHER POVERTY
0.0/ 100
METRIC RATING
278th/ 347
METRIC RANK
15.2%
SINGLE FATHER POVERTY
99.8/ 100
METRIC RATING
66th/ 347
METRIC RANK

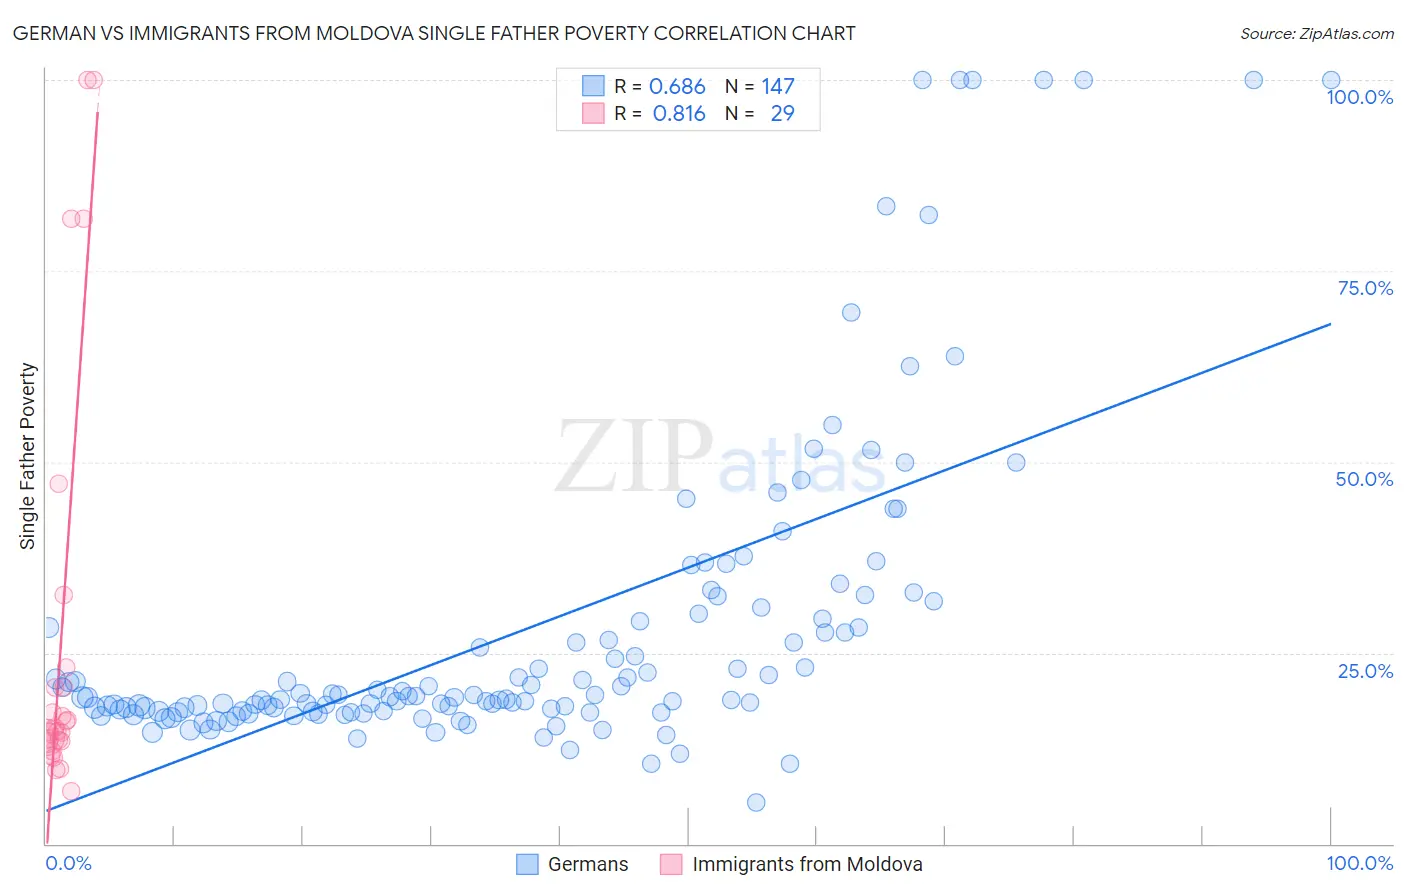
German vs Immigrants from Moldova Single Father Poverty Correlation Chart

The statistical analysis conducted on geographies consisting of 412,171,316 people shows a significant positive correlation between the proportion of Germans and poverty level among single fathers in the United States with a correlation coefficient (R) of 0.686 and weighted average of 17.7%. Similarly, the statistical analysis conducted on geographies consisting of 107,585,694 people shows a very strong positive correlation between the proportion of Immigrants from Moldova and poverty level among single fathers in the United States with a correlation coefficient (R) of 0.816 and weighted average of 15.2%, a difference of 16.5%.
German vs Immigrants from Moldova Single Father Poverty

Single Father Poverty Correlation Summary

MeasurementGermanImmigrants from Moldova
Minimum5.4%6.9%
Maximum100.0%100.0%
Range94.6%93.1%
Mean28.0%26.8%
Median19.2%14.7%
Interquartile 25% (IQ1)17.4%13.3%
Interquartile 75% (IQ3)29.5%21.8%
Interquartile Range (IQR)12.1%8.4%
Standard Deviation (Sample)20.7%27.4%
Standard Deviation (Population)20.6%26.9%

Similar Demographics by Single Father Poverty

Demographics Similar to Germans by Single Father Poverty

In terms of single father poverty, the demographic groups most similar to Germans are Lebanese (17.7%, a difference of 0.010%), Iroquois (17.7%, a difference of 0.15%), German Russian (17.7%, a difference of 0.16%), Scottish (17.7%, a difference of 0.19%), and British West Indian (17.7%, a difference of 0.22%).
DemographicsRating | RankSingle Father Poverty
French American Indians
0.2
/100
|
#271
Tragic
17.4%
Barbadians
0.1
/100
|
#272
Tragic
17.5%
Italians
0.1
/100
|
#273
Tragic
17.5%
Macedonians
0.1
/100
|
#274
Tragic
17.7%
British West Indians
0.0
/100
|
#275
Tragic
17.7%
German Russians
0.0
/100
|
#276
Tragic
17.7%
Lebanese
0.0
/100
|
#277
Tragic
17.7%
Germans
0.0
/100
|
#278
Tragic
17.7%
Iroquois
0.0
/100
|
#279
Tragic
17.7%
Scottish
0.0
/100
|
#280
Tragic
17.7%
English
0.0
/100
|
#281
Tragic
17.8%
Dutch
0.0
/100
|
#282
Tragic
17.8%
Alsatians
0.0
/100
|
#283
Tragic
17.8%
Welsh
0.0
/100
|
#284
Tragic
17.8%
Immigrants | Lebanon
0.0
/100
|
#285
Tragic
17.9%

Demographics Similar to Immigrants from Moldova by Single Father Poverty

In terms of single father poverty, the demographic groups most similar to Immigrants from Moldova are Immigrants from Malaysia (15.2%, a difference of 0.020%), Paraguayan (15.2%, a difference of 0.090%), Bangladeshi (15.2%, a difference of 0.11%), Immigrants from Cameroon (15.2%, a difference of 0.18%), and Immigrants from Sweden (15.2%, a difference of 0.19%).
DemographicsRating | RankSingle Father Poverty
Guamanians/Chamorros
99.9
/100
|
#59
Exceptional
15.1%
Puget Sound Salish
99.8
/100
|
#60
Exceptional
15.2%
Immigrants | Bosnia and Herzegovina
99.8
/100
|
#61
Exceptional
15.2%
Immigrants | Armenia
99.8
/100
|
#62
Exceptional
15.2%
Immigrants | Sweden
99.8
/100
|
#63
Exceptional
15.2%
Bangladeshis
99.8
/100
|
#64
Exceptional
15.2%
Immigrants | Malaysia
99.8
/100
|
#65
Exceptional
15.2%
Immigrants | Moldova
99.8
/100
|
#66
Exceptional
15.2%
Paraguayans
99.7
/100
|
#67
Exceptional
15.2%
Immigrants | Cameroon
99.7
/100
|
#68
Exceptional
15.2%
Japanese
99.7
/100
|
#69
Exceptional
15.2%
Mongolians
99.7
/100
|
#70
Exceptional
15.3%
Immigrants | Brazil
99.6
/100
|
#71
Exceptional
15.3%
Immigrants | Lithuania
99.6
/100
|
#72
Exceptional
15.3%
Kenyans
99.6
/100
|
#73
Exceptional
15.3%