German vs Immigrants from Central America Single Male Poverty
COMPARE
German
Immigrants from Central America
Single Male Poverty
Single Male Poverty Comparison
Germans
Immigrants from Central America
13.9%
SINGLE MALE POVERTY
0.1/ 100
METRIC RATING
267th/ 347
METRIC RANK
13.8%
SINGLE MALE POVERTY
0.3/ 100
METRIC RATING
257th/ 347
METRIC RANK
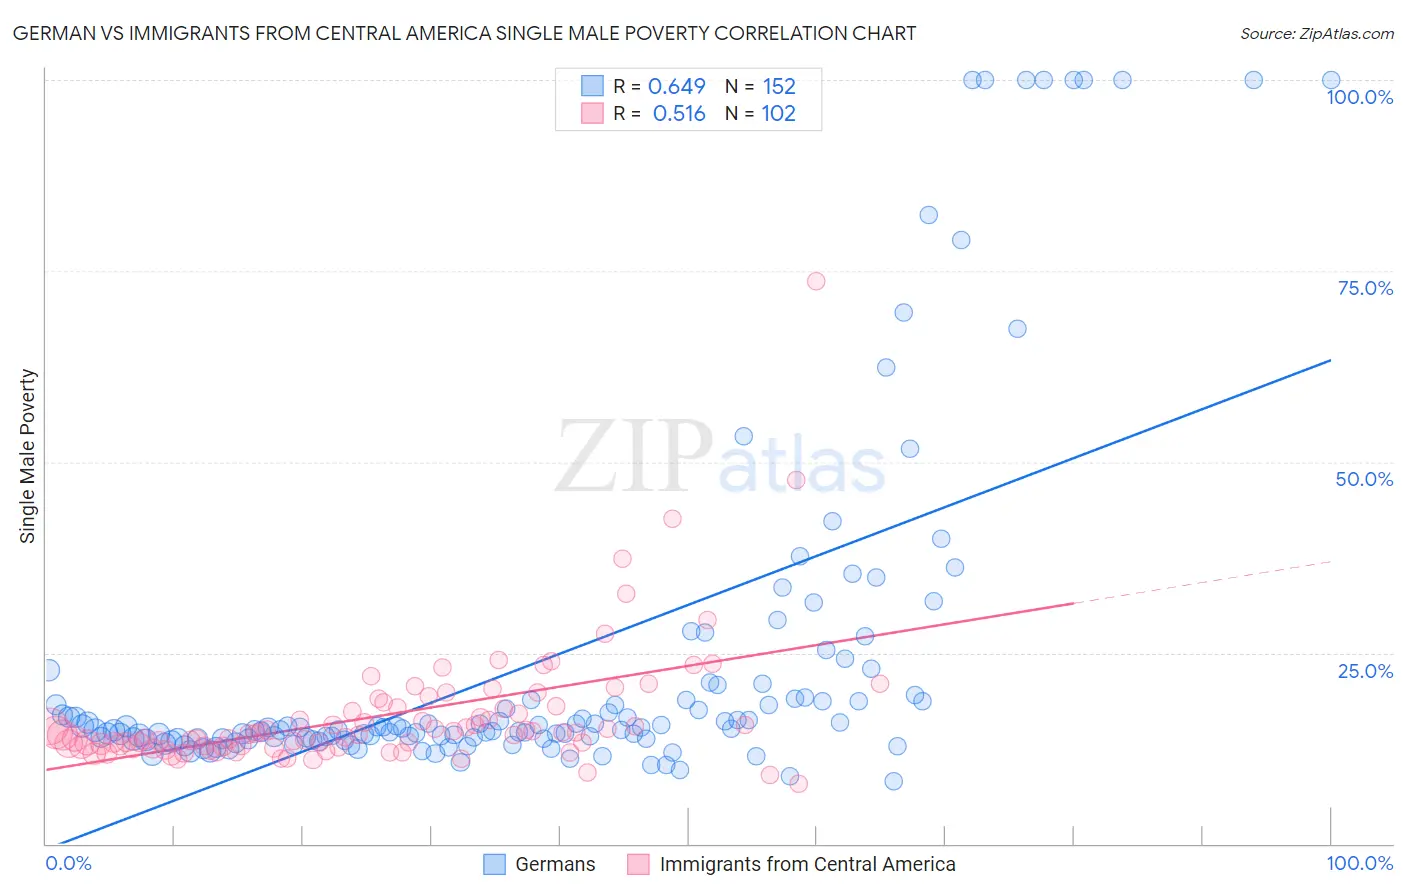
German vs Immigrants from Central America Single Male Poverty Correlation Chart
The statistical analysis conducted on geographies consisting of 476,219,018 people shows a significant positive correlation between the proportion of Germans and poverty level among single males in the United States with a correlation coefficient (R) of 0.649 and weighted average of 13.9%. Similarly, the statistical analysis conducted on geographies consisting of 454,315,872 people shows a substantial positive correlation between the proportion of Immigrants from Central America and poverty level among single males in the United States with a correlation coefficient (R) of 0.516 and weighted average of 13.8%, a difference of 1.3%.
Single Male Poverty Correlation Summary
| Measurement | German | Immigrants from Central America |
| Minimum | 8.2% | 7.9% |
| Maximum | 100.0% | 73.6% |
| Range | 91.8% | 65.7% |
| Mean | 23.9% | 16.8% |
| Median | 15.1% | 14.4% |
| Interquartile 25% (IQ1) | 13.8% | 12.7% |
| Interquartile 75% (IQ3) | 19.0% | 17.9% |
| Interquartile Range (IQR) | 5.3% | 5.2% |
| Standard Deviation (Sample) | 22.7% | 8.5% |
| Standard Deviation (Population) | 22.7% | 8.5% |
Demographics Similar to Germans and Immigrants from Central America by Single Male Poverty
In terms of single male poverty, the demographic groups most similar to Germans are Immigrants from Mexico (13.9%, a difference of 0.070%), Immigrants from Cabo Verde (13.9%, a difference of 0.16%), Scottish (14.0%, a difference of 0.22%), Immigrants from Saudi Arabia (14.0%, a difference of 0.23%), and Irish (14.0%, a difference of 0.27%). Similarly, the demographic groups most similar to Immigrants from Central America are Immigrants from Guatemala (13.8%, a difference of 0.070%), Guatemalan (13.8%, a difference of 0.11%), Immigrants from Belize (13.7%, a difference of 0.18%), Swiss (13.8%, a difference of 0.18%), and Hungarian (13.8%, a difference of 0.23%).
| Demographics | Rating | Rank | Single Male Poverty |
| Finns | 0.9 /100 | #252 | Tragic 13.6% |
| German Russians | 0.8 /100 | #253 | Tragic 13.6% |
| Sub-Saharan Africans | 0.5 /100 | #254 | Tragic 13.7% |
| Spaniards | 0.4 /100 | #255 | Tragic 13.7% |
| Immigrants | Belize | 0.4 /100 | #256 | Tragic 13.7% |
| Immigrants | Central America | 0.3 /100 | #257 | Tragic 13.8% |
| Immigrants | Guatemala | 0.3 /100 | #258 | Tragic 13.8% |
| Guatemalans | 0.3 /100 | #259 | Tragic 13.8% |
| Swiss | 0.3 /100 | #260 | Tragic 13.8% |
| Hungarians | 0.3 /100 | #261 | Tragic 13.8% |
| Fijians | 0.3 /100 | #262 | Tragic 13.8% |
| Cape Verdeans | 0.2 /100 | #263 | Tragic 13.8% |
| West Indians | 0.2 /100 | #264 | Tragic 13.8% |
| Immigrants | Congo | 0.2 /100 | #265 | Tragic 13.9% |
| Immigrants | Cabo Verde | 0.1 /100 | #266 | Tragic 13.9% |
| Germans | 0.1 /100 | #267 | Tragic 13.9% |
| Immigrants | Mexico | 0.1 /100 | #268 | Tragic 13.9% |
| Scottish | 0.1 /100 | #269 | Tragic 14.0% |
| Immigrants | Saudi Arabia | 0.1 /100 | #270 | Tragic 14.0% |
| Irish | 0.1 /100 | #271 | Tragic 14.0% |
| Mexicans | 0.1 /100 | #272 | Tragic 14.0% |